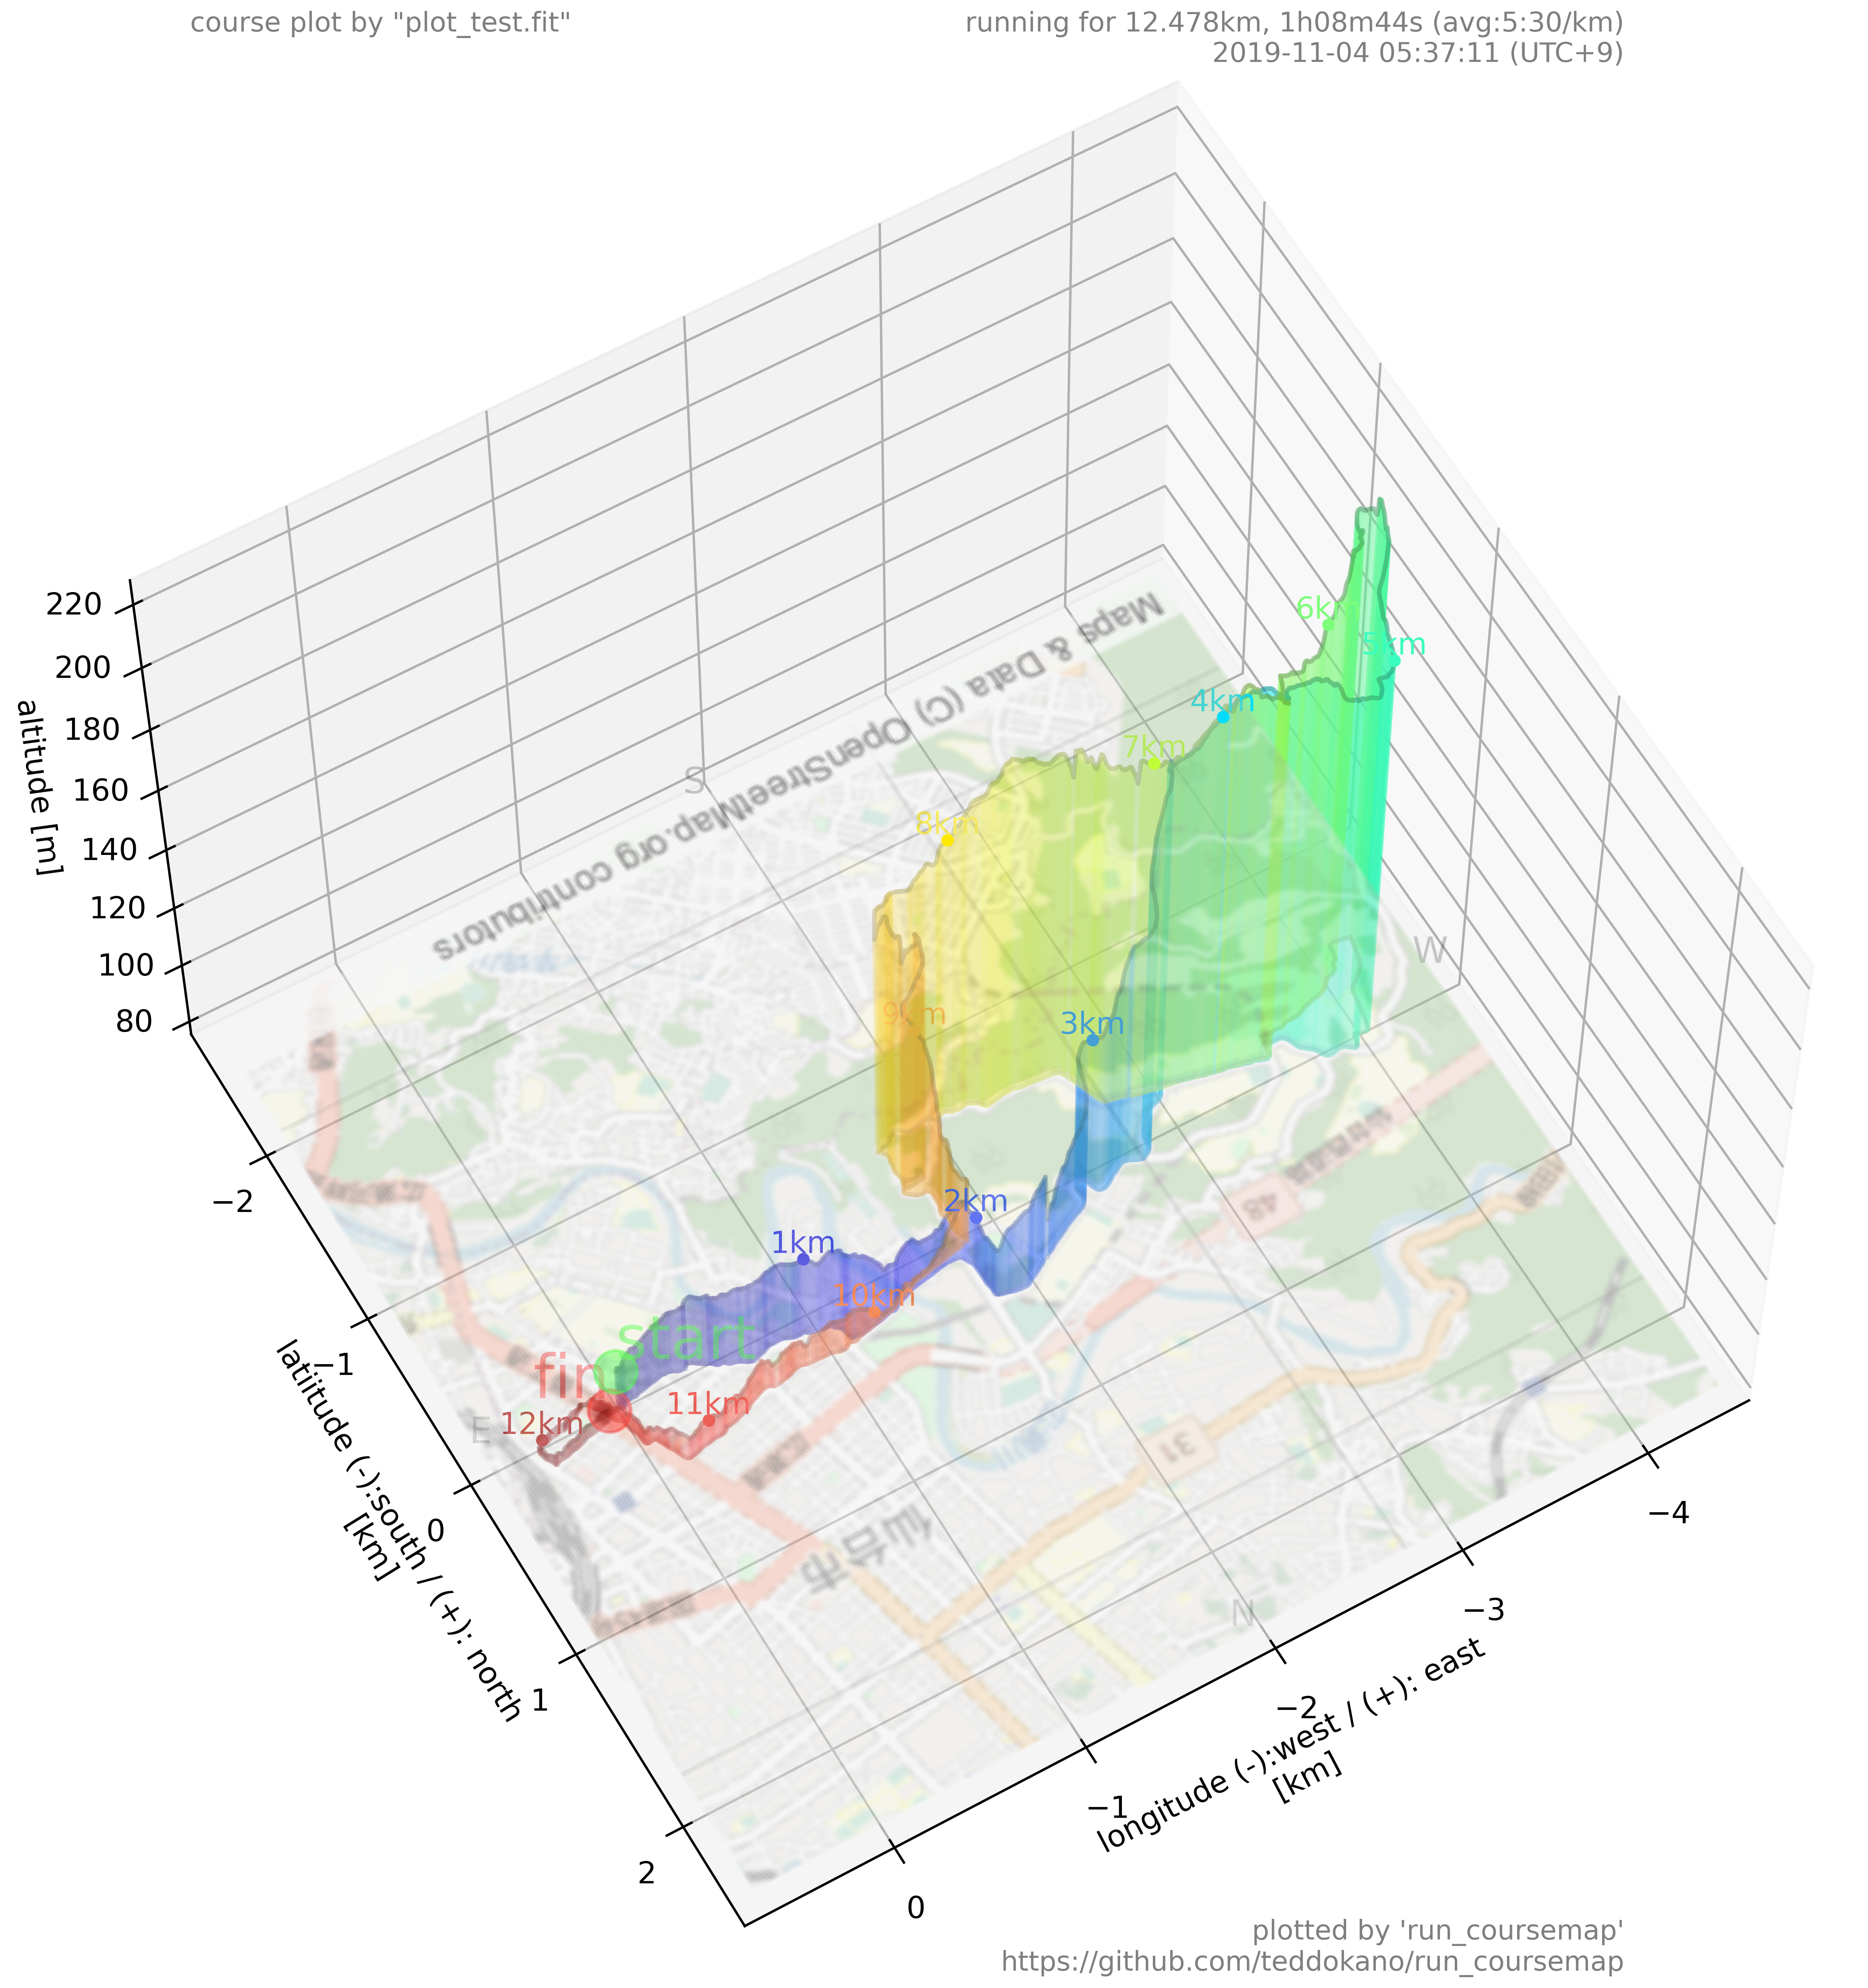
Reads .fit file and plot course profile in 3D. Try plot with "plot_test.fit" in this project folder. It shows live (rotatable) 3D image.
type run_coursemap.py py-plot_test.fit in command line.
for more infomation, type run_coursemap.py -h.
NOTE: This code is experimental very early version. Should be optimized for processing speed
verion 0.2: feature added: curtain color can be changed by distance/altitude/speed/power


