![]()
The EC50, or the "half maximal effective concentration", is a key measure of the effectiveness of a compound to affect a biological system. It is commonly used in pharmacology, biology and biochemistry. The EC50 is calculated by fitting the dose-response data to a sigmoidal curve, typically using the Hill equation. Variants include the half maximal "lethal dose" (LD50), and "inhibitor concentration" (IC50).
- fully automated
- fitting of sigmoidal curves to dose-response data
- calculation of EC50, LD50 or IC50 values.
- high-throughput analysis
- comparison of EC50 values from different experiments
- calculation of EC25 or EC75 values
- accepts REAL biological data
- pre-filtering excludes nonsense data
- judgefit module identifies low-quality EC50 values
- easy-to-use excel files:
- excel settings file
- excel input file with dose and response data
- excel output file with EC50 values
- simple graphical output:
- sigmoidal curves with EC50 shown on graph
- daily summary barcharts and curves
- simple python syntax
- open-source software
- built on powerful numpy, scipy, and pandas packages
ECCpy has been used extensively for the analysis of LD50 assays by bachelor, master and PhD students within the lab of Dieter Langosch at the Technical University of Munich in Germany. However this software is released "as is", and may contain bugs related to particular data types, python versions or operating systems.
As described in the wiki, ECCpy was originally developed for Anaconda 2020.7 and python 3.8. Until the code is updated to a later version of python, it's strongly recommended to install ECCpy into a dedicated virtual environment with python 3.8 and install the exact package versions specified in the requirements.txt.
Example using conda, based on the Anaconda python distribution or Miniforge:
conda create -n eccpy python=3.8
conda activate eccpy
git clone git@github.com:teese/eccpy.git
cd eccpy
pip install -r requirements.txt
pip install --editable .
pip install eccpy might also still work, so long as it's in an environment with python 3.8
- After downloading ECCpy from github, run
python -m pytest --disable-warningsin the ECCpy repository directory to automatically start tests. The tests should all pass, with some deprecation warnings. - before processing your own data, run eccpy on the provided example files provided, following the instructions in the ECCpy wiki.
- example data is available in eccpy/examples/example_data
- example settings are available in eccpy/examples/example_settings
As described in the wiki, ECCpy requires only the following three steps:
- 1) Prepare your data.
- use the excel or microplate templates in the eccpy/templates folder
- for the generic excel format, simply open the template and paste in your dose and response data.
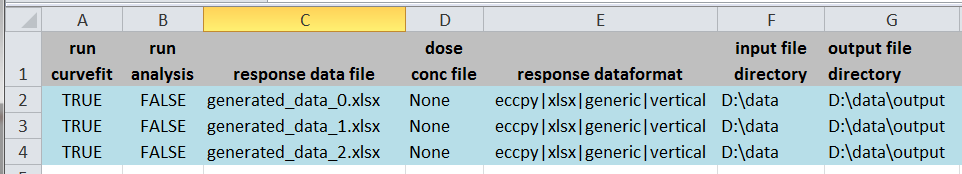
- 2) Update an excel settings file
- copy the ECCpy_settings_template.xlsx from eccpy/templates
- open the excel file, input the name and location of your datafiles, and the desired location for your output files
- write "TRUE" next to the files you want to examine
- 3) Run ECCpy
- run the ipython/jupyter notebook, which opens a python interpreter in your web browser
- paste in the following four lines. Replace the location of your settings file.
- hit Ctrl-Enter to run
- based on your output, adjust the quality thresholds in the settings file to suit your data
Example :
import eccpy
settings = r"D:\data\ECCpy_settings.xlsx"
eccpy.run_curvefit(settings)
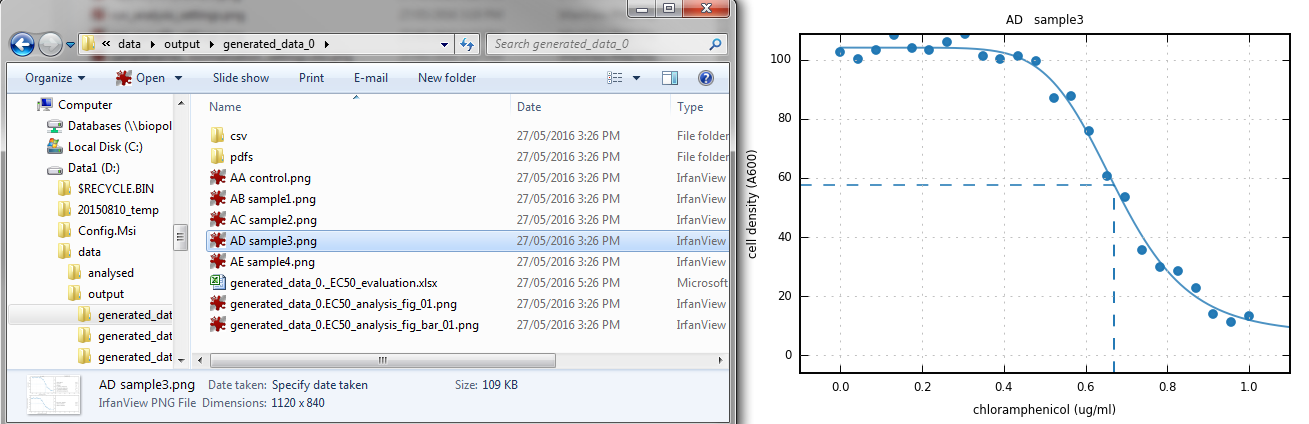
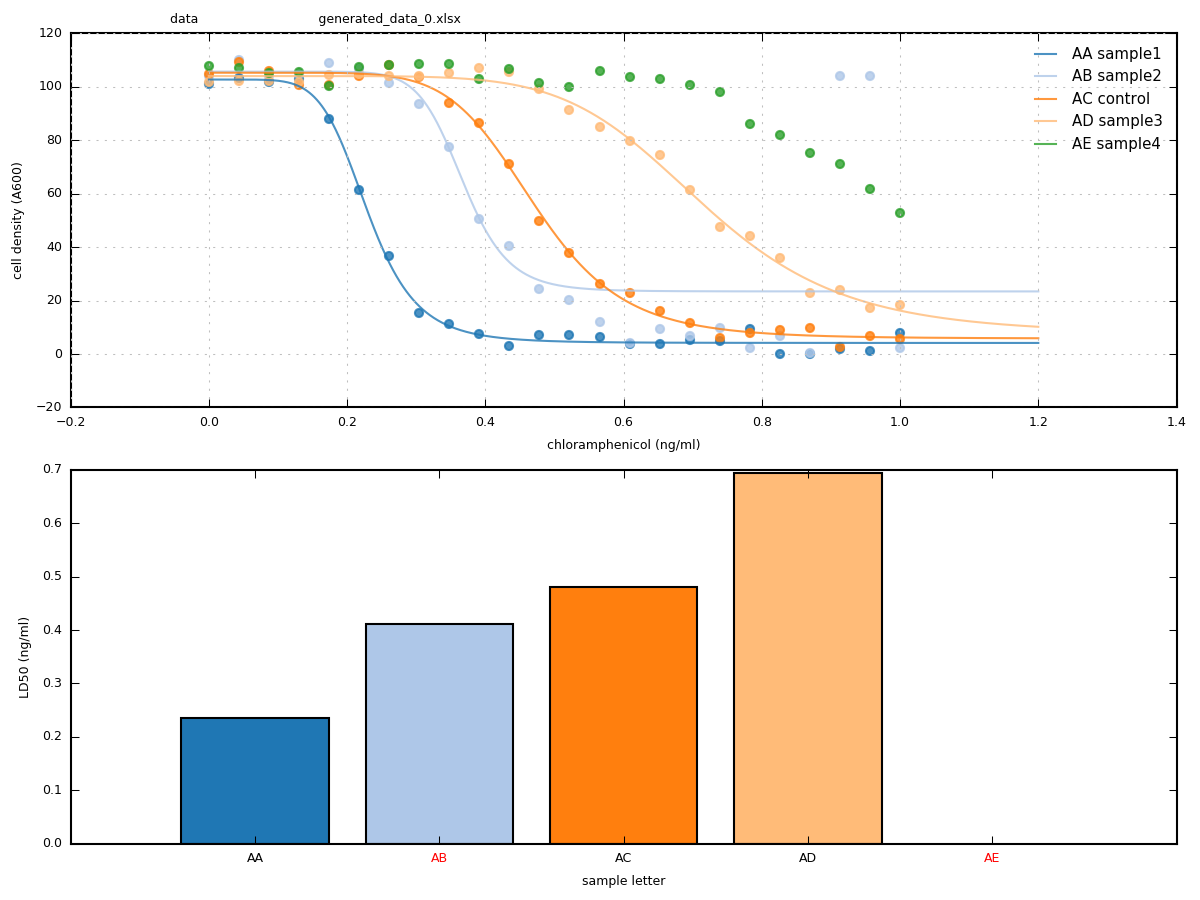
eccpy.run_gatherer(settings)- run_curvefit program
- individual dose-response curves
- automatic judging of data quality
- daily summary curves, barchart and more!
run_gatherer program
- combines data from multiple experiments
- excludes EC50 values that are not of sufficient quality, according to user-defined thresholds
- bar charts with mean and SEM over all selected experiments
- scatter plots showing individual datapoints for each day/experiment, and more!
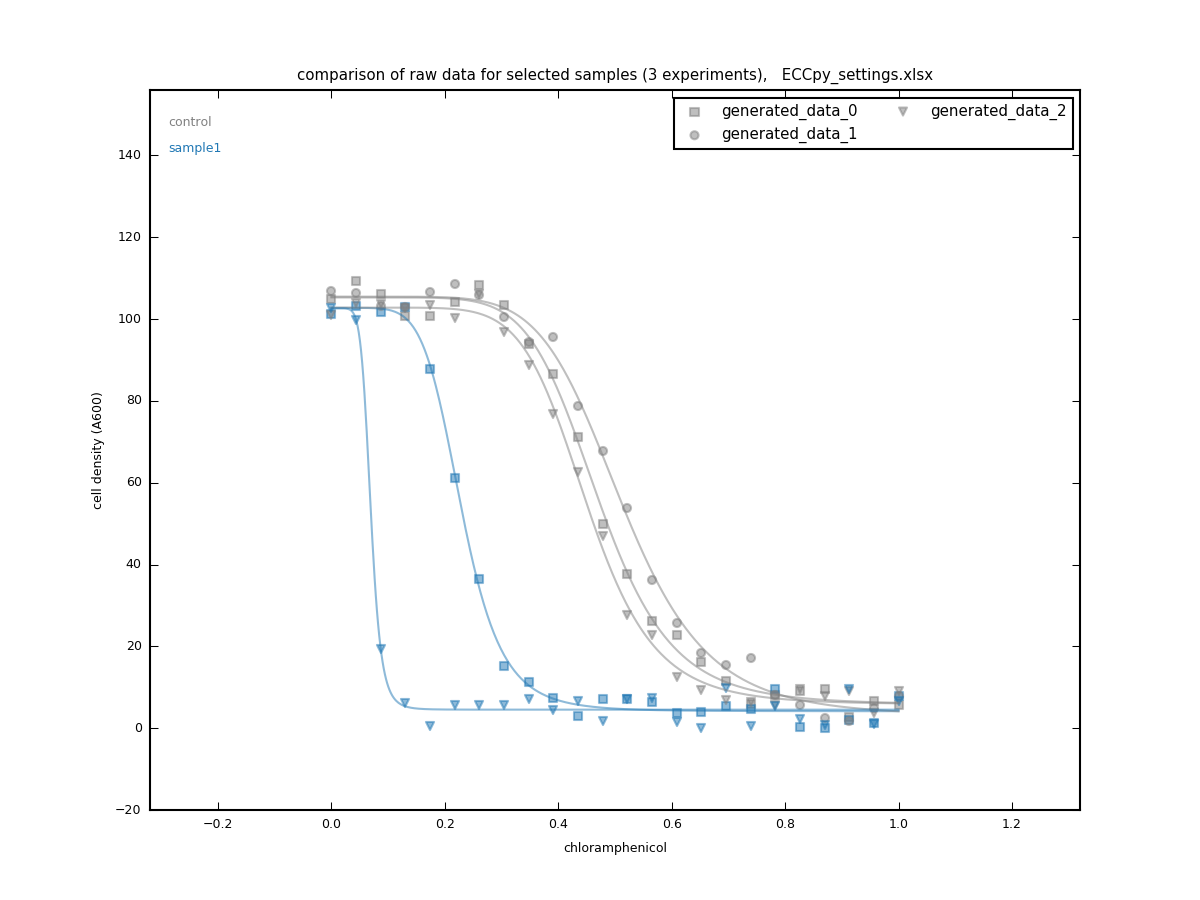
compare_rawdata program
- collects raw data and dose-response curves from multiple experiments
- compares datapoints and fitted curves between the selected samples
You can also check out a "how to install and run ECCpy" video by following the link below:
https://www.youtube.com/watch?v=H-cRd3-vKVg
ECCpy is free software distributed under the permissive MIT license.
Release-notes are found in /docs/releases.rst
If you use ECCpy in your research, please use the following citation.
Schanzenbach C, Schmidt FC, Breckner P, Teese MG, & Langosch D (2017) Identifying ionic interactions within a membrane using BLaTM, a genetic tool to measure homo-and heterotypic transmembrane helix-helix interactions. Scientific Reports 7(7):43476.
https://www.ncbi.nlm.nih.gov/pubmed/28266525
ECCpy needs you!
ECCpy was developed by Mark Teese during his postdoc at the Langosch lab of the Technical University of Munich. However, since then, Professor Langosch has retired, and the the software is no longer under active development.
Please contact Mark at the email address below if you're interested in helping develop or maintain ECCpy.