CS3211 Project - Data Analysis Portion
This repository is part of a submission for NUS AY2020/21 S2's CS3211 Project.
So, the project requires us to generate a simulation of a football match using the Process Analysis Toolkit (PAT) program provided here. To do this, we had to use PAT to model the concurrent behaviours in a match. Since PAT supports probabilistic models, some data mining is required to approximate the probabilities required for modelling.
The solution in this repository approached the problem by using PAT to generate a giant Hidden Markov Model (HMM) to simulate the match. To generate the probabilities for each edge in the HMM, data mining had to be done on an actual football dataset.
This repository shows some exploratory data work done to plot the passes and shots taken in any football competition, using the base open-data dataset.
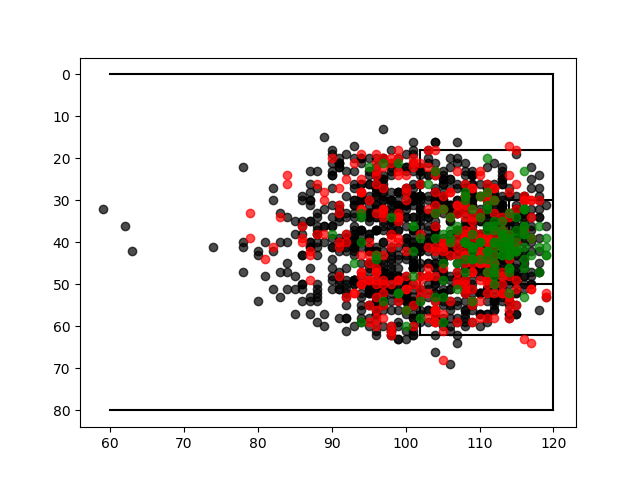
These plots are then used to determine how to segregate the pitch so raw event data can be quantized appropriately to find the probability of an event in each zone. For example, the shots plot below showed that the data is too dense for K-Means clustering to be done, and it was more appropriate to use footballing domain knowledge to segment the zones. It also shows that most shots in the 6-yard box went in, followed by shots in the narrow 6-yard space within the 30-yard box. Shots from elsewhere tended to not become goals even if they are on target.
 (Green: Goals, Red: On-Target, Black: Off-Target)
This repository also shows how to gather the shots and passes performed per team. This is done by getting all the shots and passes events related to a team, and then filtering out the outcomes we want to derive each probability value. The list of probabilities looked for are here:
Shots
- P(goal | position) = P(shot_taken | position) * P(on_target | position) * P(not_blocked | position)
- P(shot_taken | position) = num_shots[position] / (num_shots[position] + num_passes[position])
- P(not_blocked | position) = 1 - P(blocked | position)
- P(blocked | position) = num_goals(opposition)[position] / num_on_target_shots_faced(opposition)[position]
- P(on_target | position) = num_on_target[position] / num_shots[position] Passes
- P(pass_successful | position, target) = P(pass_made | position, target) * P(accurate | position, target) * P(not_intercepted | position, target)
- P(pass_made | position, target) = num_passes[position][target] / (num_passes[position][target] + num_shots[position])
- P(not_intercepted | position, target) = 1 - P(intercepted | position, target)
- P(intercepted | position, target) = num_failed_passes_faced(opposition)[target] / num_accurate_passes_faced(opposition)[target]
- P(accurate | position, target) = num_accurate_passes[position][target] / num_passes[position][target]
These probabilities are then converted into #define statements to be consumed within PAT itself using the state-of-the-art method of copy-pasting!!! 😁
Environment
- Windows 10
- Python 3.7.4 (Conda)
- Conda 4.8.2
How to install
- cd
playground git clone https://github.com/statsbomb/socplot.git socplot_dep && mv socplot_dep/socplot . && rm -rf socplot_dep
Usage
- cd
playground - To generate passes plot, run
python plot_passes.py - To generate shots plot, run
python plot_shots.py - To generate probabilities for shots and passes faced/taken in each pitch zone by a team, run
python shots_and_passes_per_team.py
- The script supports command args too to vary the competition and team.
- E.g. The default is to get England's World Cup 2018 stats. (
python shots_and_passes_per_team.py) - You can add prefixes to the
#definestatements generated too, e.g.python shots_and_passes_per_team.py --team_prefix=teamTwo
Permutations to Try (All from WC 2018 semis and final)
python shots_and_passes_per_team.py --team_name=france --team_prefix=teamOnepython shots_and_passes_per_team.py --team_name=belgium --team_prefix=teamTwo
python shots_and_passes_per_team.py --team_name=croatia --team_prefix=teamOnepython shots_and_passes_per_team.py --team_name=england --team_prefix=teamTwo
python shots_and_passes_per_team.py --team_name=france --team_prefix=teamOnepython shots_and_passes_per_team.py --team_name=croatia --team_prefix=teamTwo
python shots_and_passes_per_team.py --team_name=belgium --team_prefix=teamOnepython shots_and_passes_per_team.py --team_name=england --team_prefix=teamTwo
Original Repository README: StatsBomb Open Data
Welcome to the StatsBomb Open Data repository.
StatsBomb are committed to sharing new data and research publicly to enhance understanding of the game of Football. We want to actively encourage new research and analysis at all levels. Therefore we have made certain leagues of StatsBomb Data freely available for public use for research projects and genuine interest in football analytics.
StatsBomb are hoping that by making data freely available, we will extend the wider football analytics community and attract new talent to the industry. We would like to collect some basic personal information about users of our data. By giving us your email address, it means we will let you know when we make more data, tutorials and research available. We will store the information in accordance with our Privacy Policy and the GDPR.
Whilst we are keen to share data and facilitate research, we also urge you to be responsible with the data. Please register your details on https://www.statsbomb.com/resource-centre and read our User Agreement carefully.
Terms & Conditions
By using this repository, you are agreeing to the user agreement.
If you publish, share or distribute any research, analysis or insights based on this data, please state the data source as StatsBomb and use our logo, available in our Media Pack.
Getting Started
The data is provided as JSON files exported from the StatsBomb Data API, in the following structure:
- Competition and seasons stored in
competitions.json. - Matches for each competition and season, stored in
matches. Each folder within is named for a competition ID, each file is named for a season ID within that competition. - Events and lineups for each match, stored in
eventsandlineupsrespectively. Each file is named for a match ID.
Some documentation about the meaning of different events and the format of the JSON can be found in the doc directory.