Not yet 🎅.
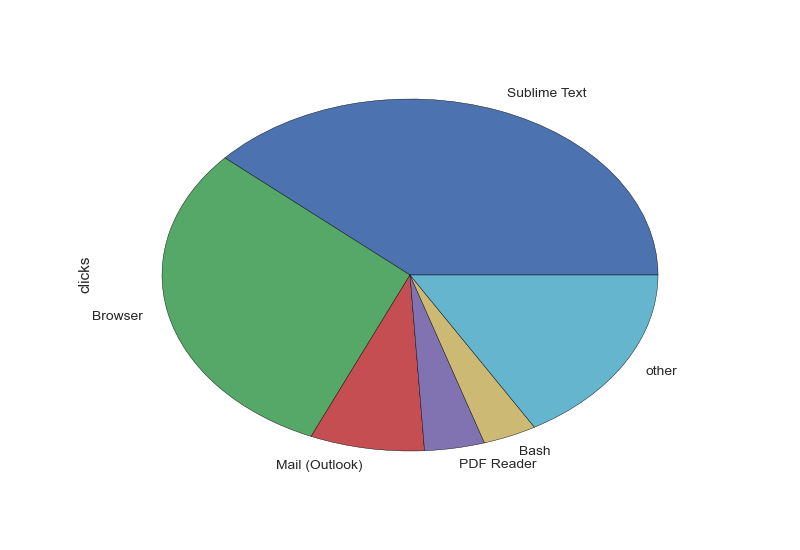
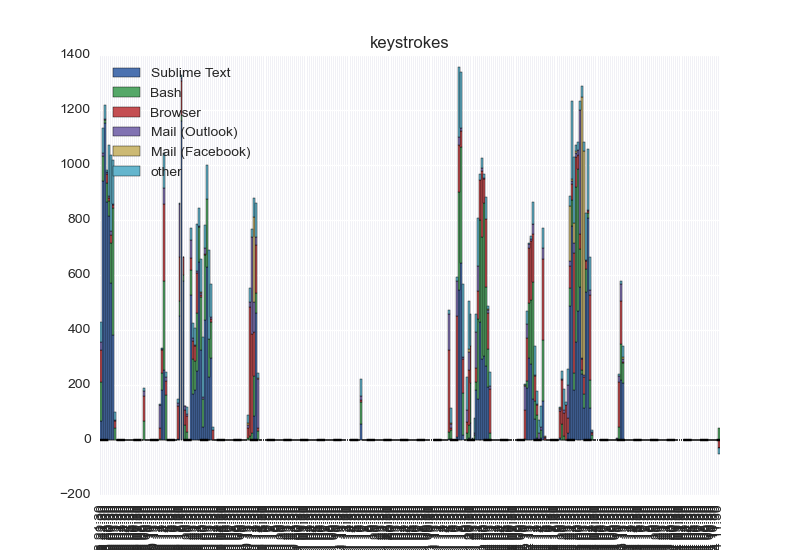
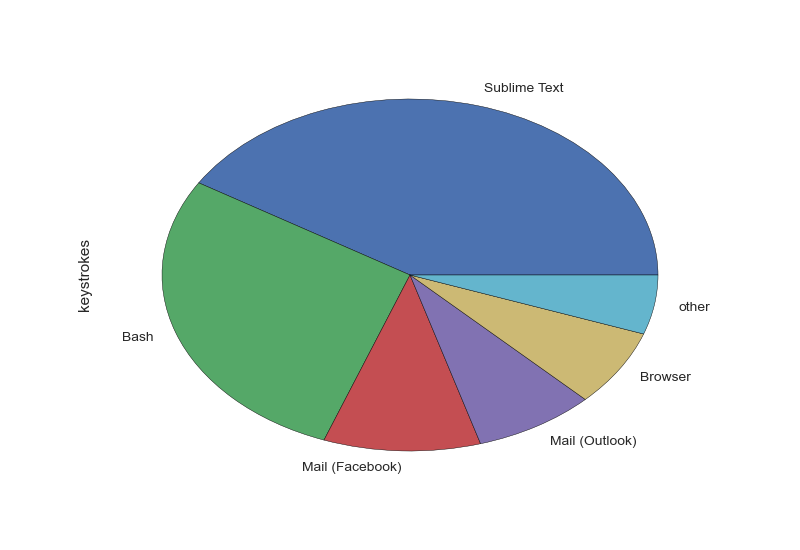
The graphs above have been generated by these commands.
You need to add selfvis.py in your PATH. And then run:
$ selfvis.py --human-readable --pactive --back 8 h
Or:
$ selfvis.py --human-readable --ratios --back 8 h
Install selfspy, then the requirements with pip :
$ pip install -r requirements.txt
You might need to give it sudo rights :
$ sudo pip install -r requirements.txt
The script is a modified version of the selfstats program.
The same options apply. Try e.g.
$ python selfvis.py
Currently implemented is a breakdown of hours (stacked bar chart) and a pie chart (all time totals). Both plots are saved for clicks and for keypresses, respectively.
It's very likely that long intervals aren't split correctly.
Filtering options of original selfstats continue to work.
See here.
In ~/.selfspy/simplification_rules.txt, add rules of the form
regexp --> name
For examples:
^\s*::\s*$ --> unknown
^(.+)::\s*$ --> \1
^(.+)::.*$ --> \1
# ^(.+)::(\w+).*$ --> \1:\2
^Firefox::.*YouTube.*$ --> Browser (Youtube)
^Firefox::.*GitHub.*$ --> Browser (GitHub)
^Firefox::.*Google Search.*$ --> Browser (search)
# ^.*Skype.*$ --> Skype
# ^.*Zimbra.*$ --> Mail
# ^.*\bmutt\b.*$ --> Mail
# ^.*\bzsh\b.*$ --> shell
to keep descriptions in legends short and expressive. Last matching rule (LHS) wins.
See this example for the rules I like.
A: Yes, use this HTML file, host it locally.
- Download it raw from here,
- Put it somewhere where your local web server can find it (
~/Public/,~/www/or whatever, depending on your system), - Generate the graphs in the same folder (you can do it on a daily basis, e.g. with a cron job,
- Access the page on your web-browser. Tadaa!
It uses StrapDown.js.
A: Yup, don't expect your graphs to be produced in two seconds, it can take up-to 15 seconds.
A: Note: You can use an option to shorten the time window used for the plot: for instance
selfvis.py --back 8 honly uses the data from the last 8h.
A: Yes, as long as you respect the terms of the GPLv3 License.
Other self-quantified projects ?
- uLogMe: keep track of your computer activity throughout the day: visualize your active window titles and the number and frequency of keystrokes, in beautiful and responsive HTML timelines.
- Munin, can also help to keep track of the uptime (and many more stats) of your (Linux) machine. See these plugins I wrote for my Munin.
- My minimalist dashboard, generated every hour (with a
crontabfile), with this bash scriptGenerateStatsMarkdown.sh.
- Forked by: Lilian Besson (Naereen),
- Original author: Hannes Schulz (temporaer).
GPLv3 Licensed (file LICENSE). © Lilian Besson, 2016.


