Tools for time-frequency analysis of noisy time series. More details can be found in the accompanying manuscript Optimal time frequency analysis for biological data - pyBOAT. For help, questions or comments please join the official chat on gitter, write an issue or start a discussion.
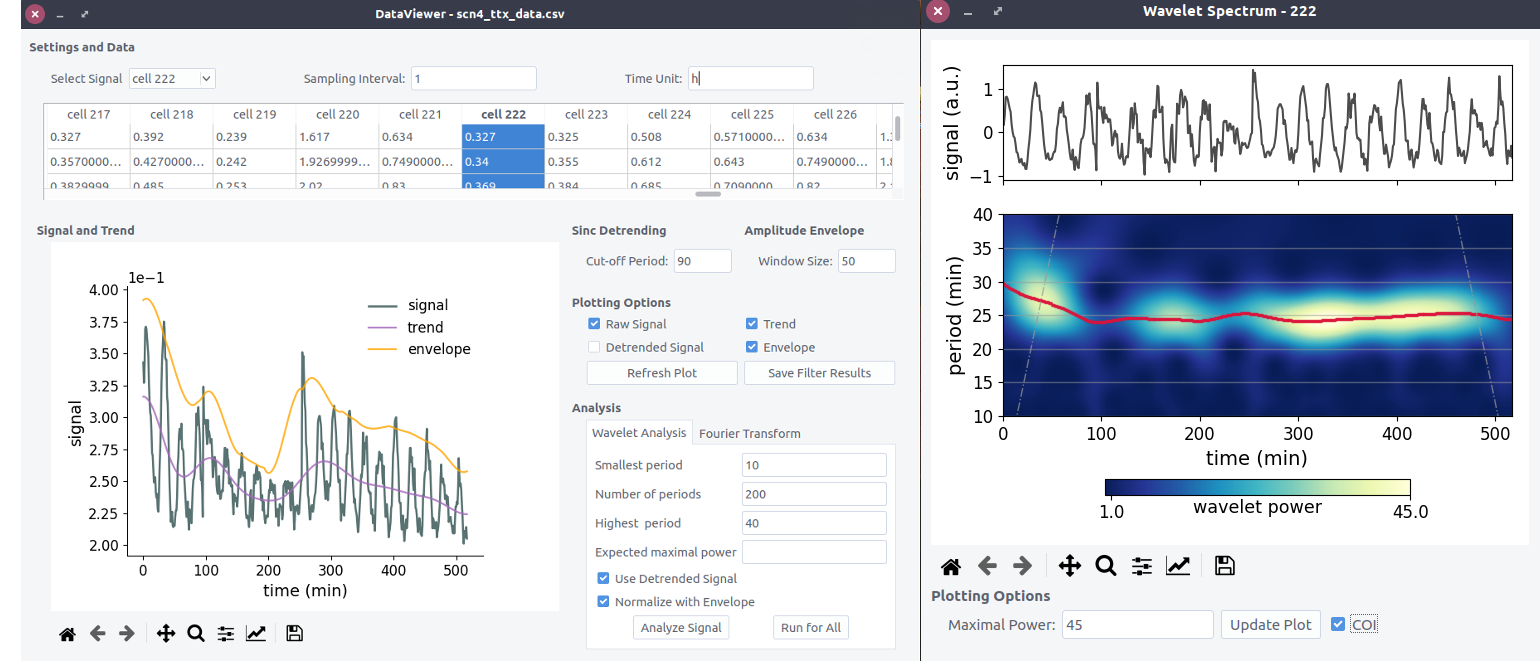
pyBOAT features a multi-layered graphical user interface. Here an example screenshot showing the DataViewer(left), where preprocessing of individual signals gets visualized, and the resulting Wavelet Spectrum with a ridge tracing the detected main oscillatory component with a
- x-platform GUI
- Optimal sinc filter
- Fourier analysis
- Wavelet analysis
- Ridge detection, phase and amplitude extraction
- Synthetic signal generator
- Ensemble statistics
See also the sister project SpyBoat for spatially resolved time-frequency analysis with wavelets.
For the public API see the single signal demonstration and the ensemble statistics example. Consult the respective Python docstrings for further details.
conda install -c conda-forge pyboat


