Built an interactive webpage to explore the nature of human trafficking globally. Some of the key takeaways include:
-
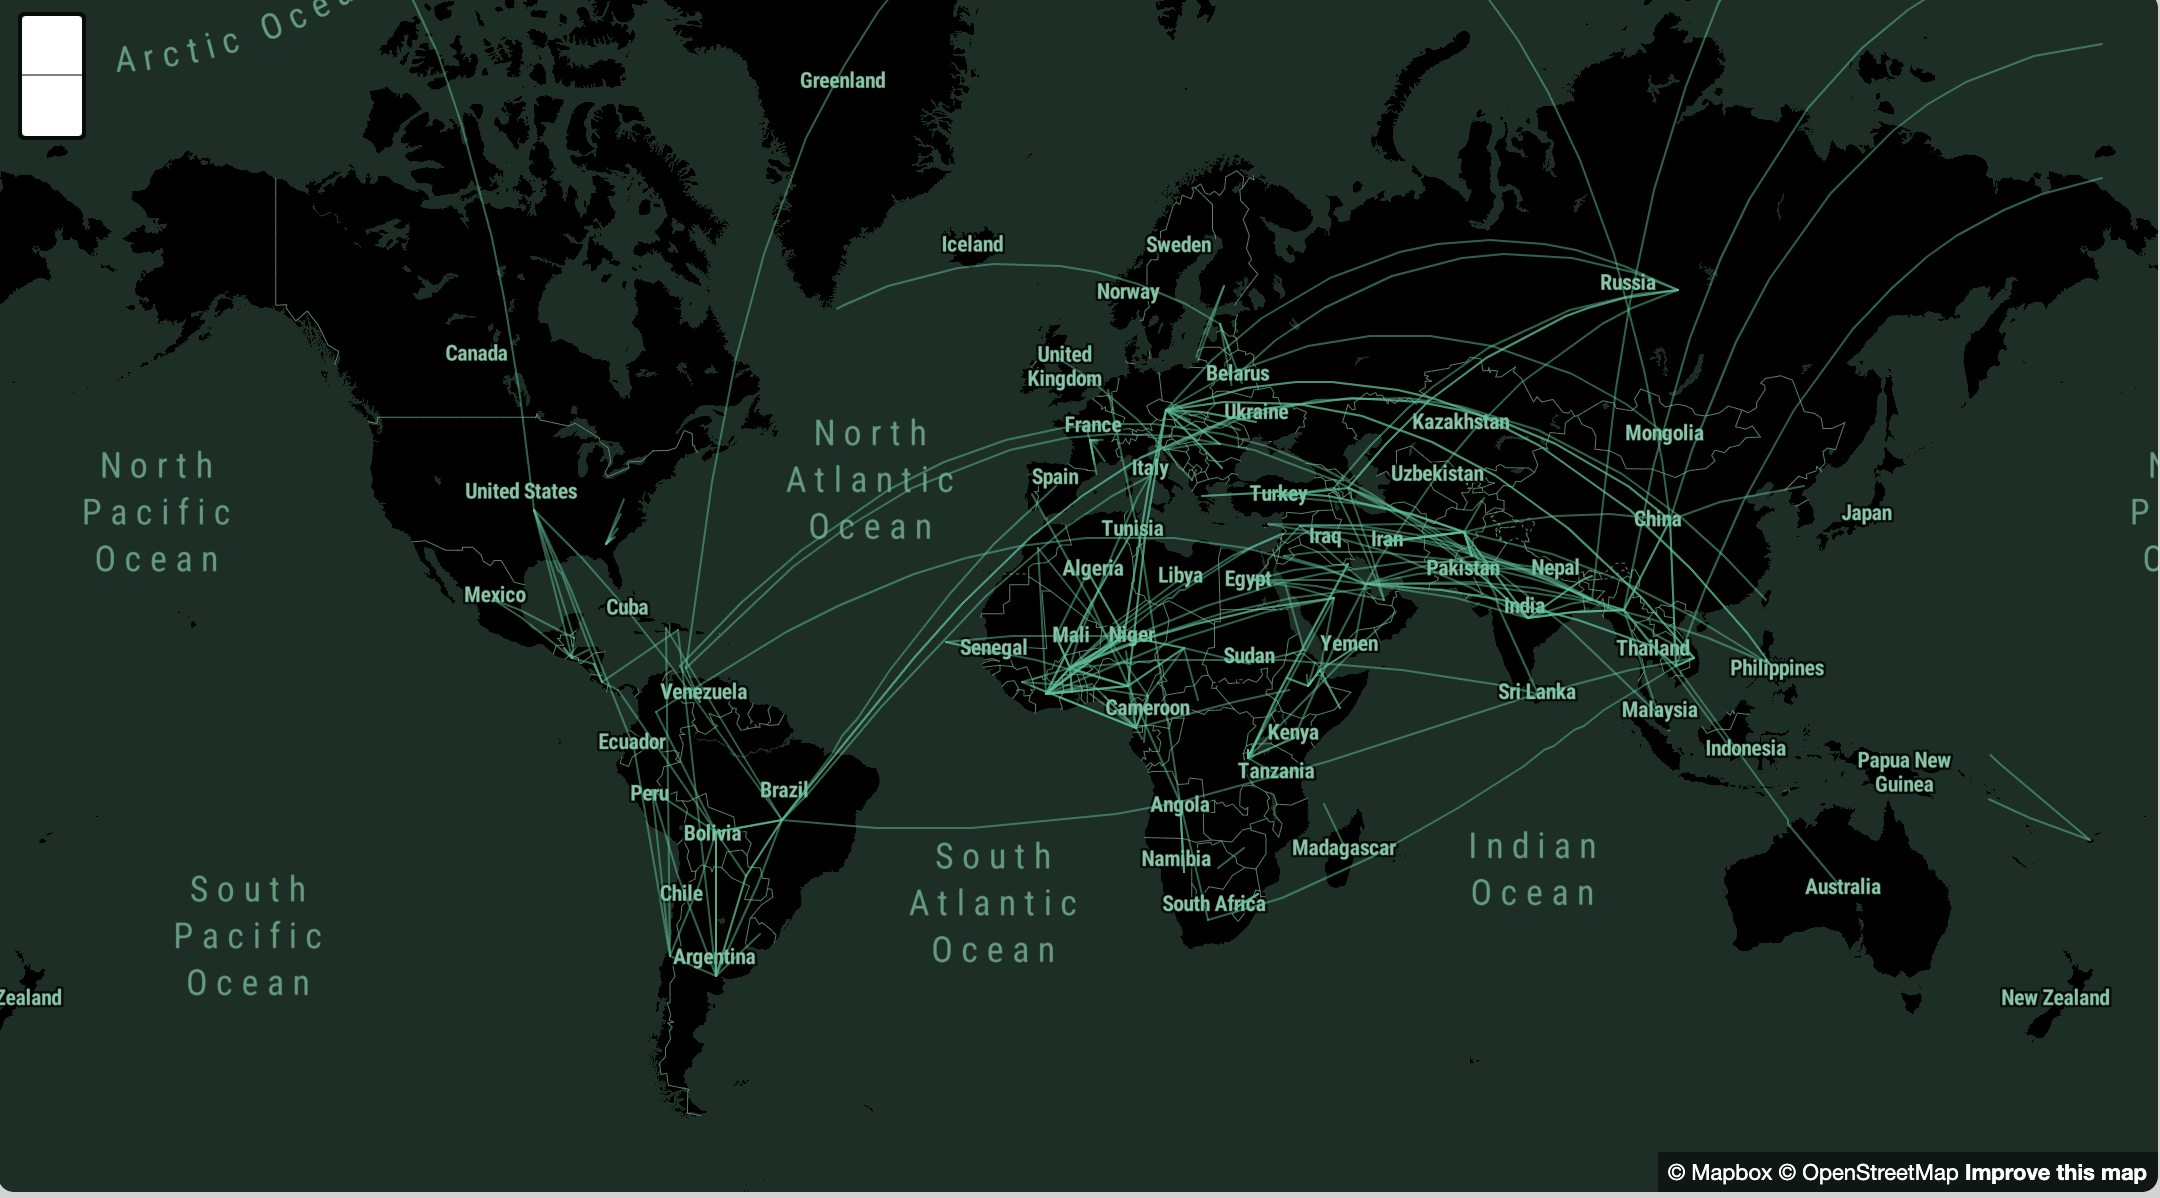
Network map showing human trafficking routes globally;
-
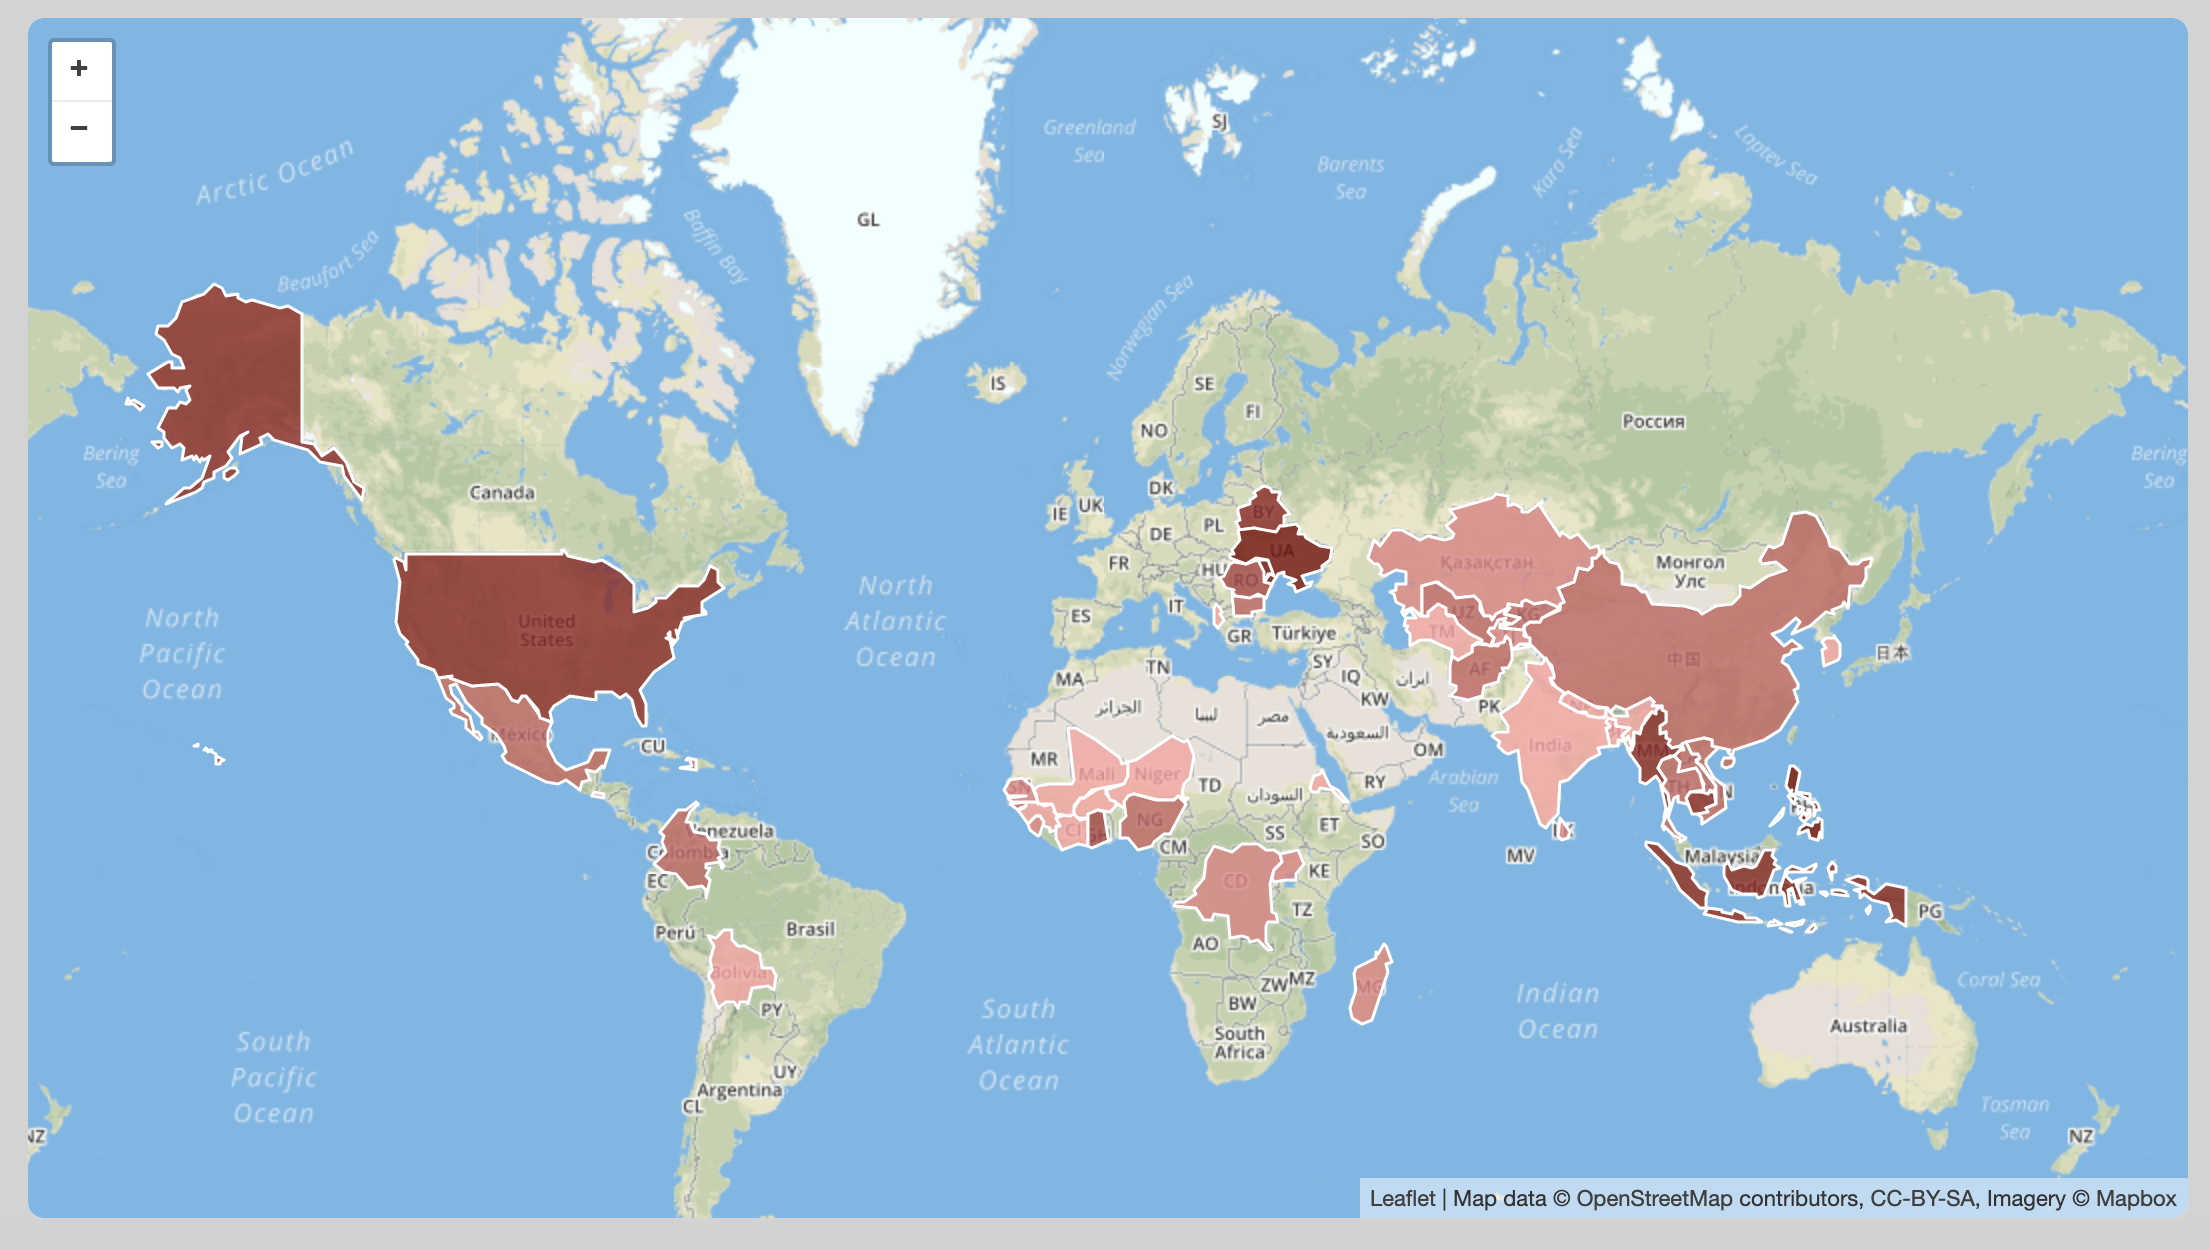
Hot spot maps that show the density of human trafficking events globally with poverty rates as tile layers;
-
Interactive scatter plot of frequency of human trafficking events and country demographics;
-
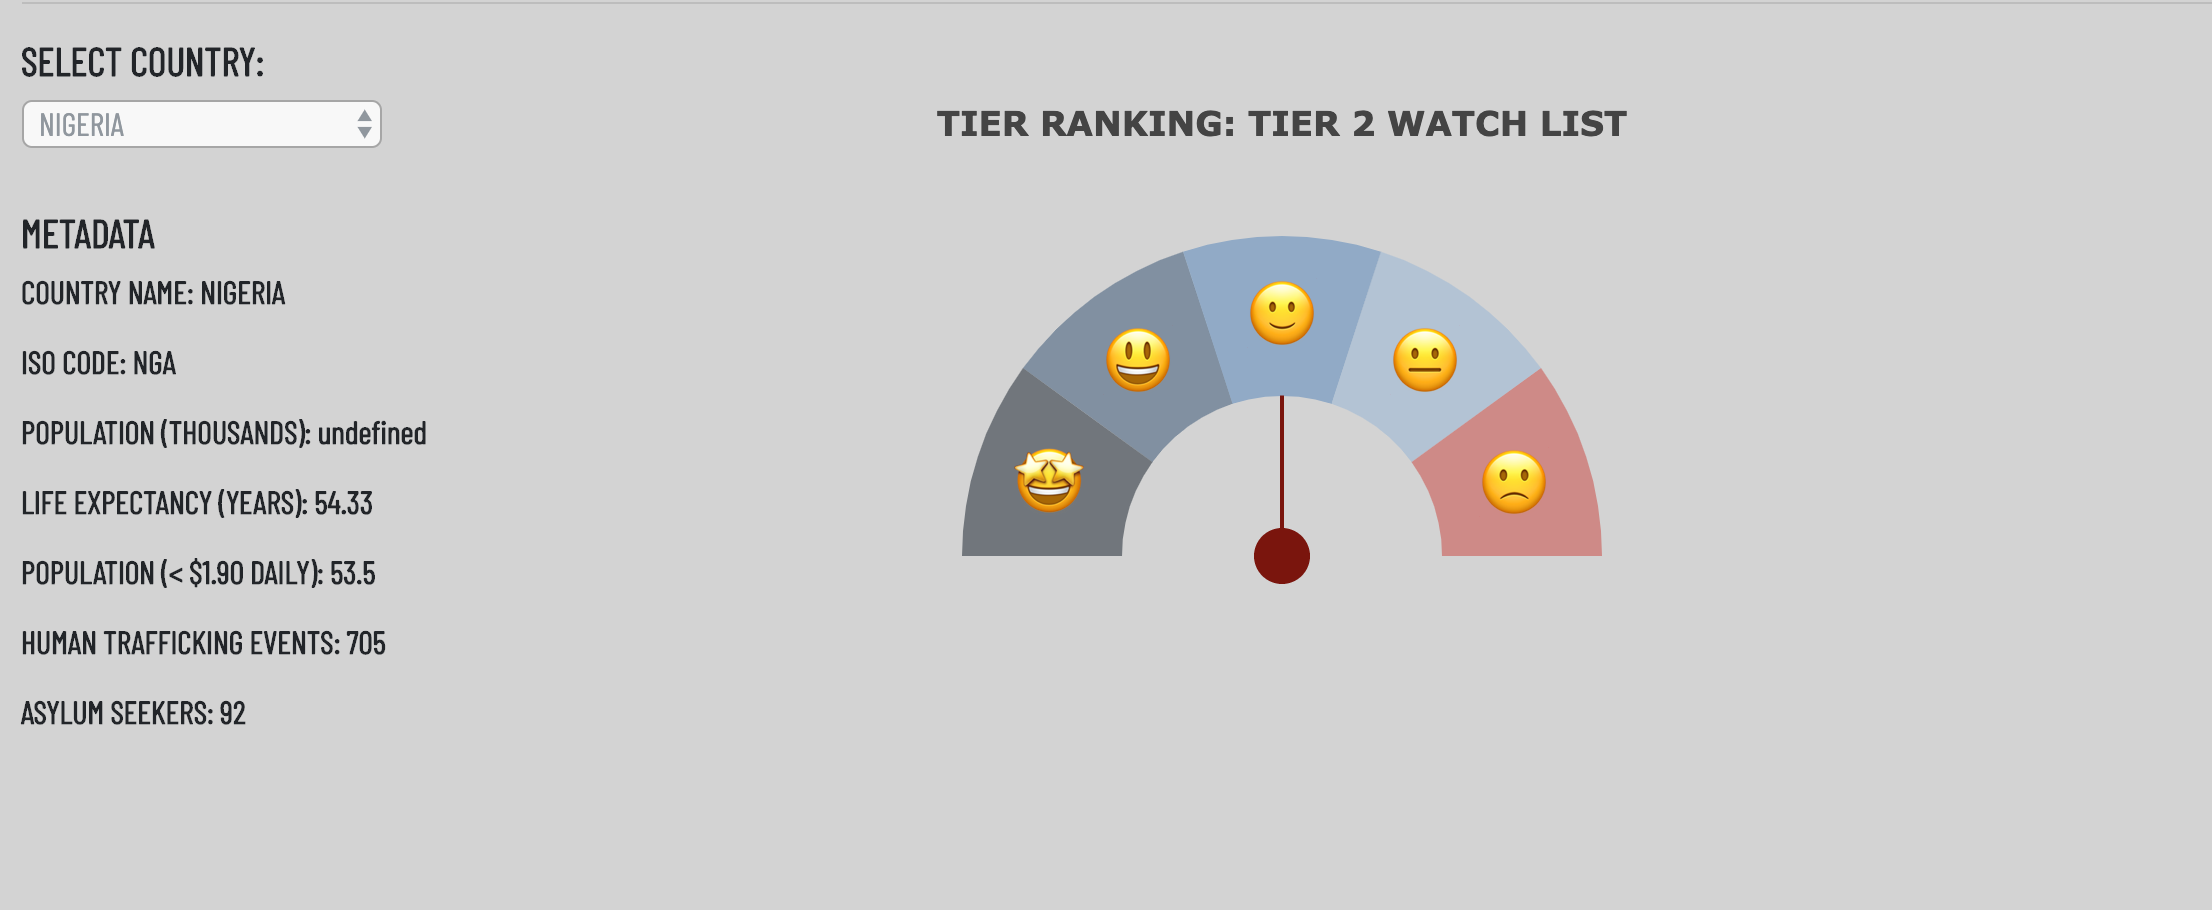
Gauge plot showing TIER ranking of each country according to the 2018 TIP report;
-
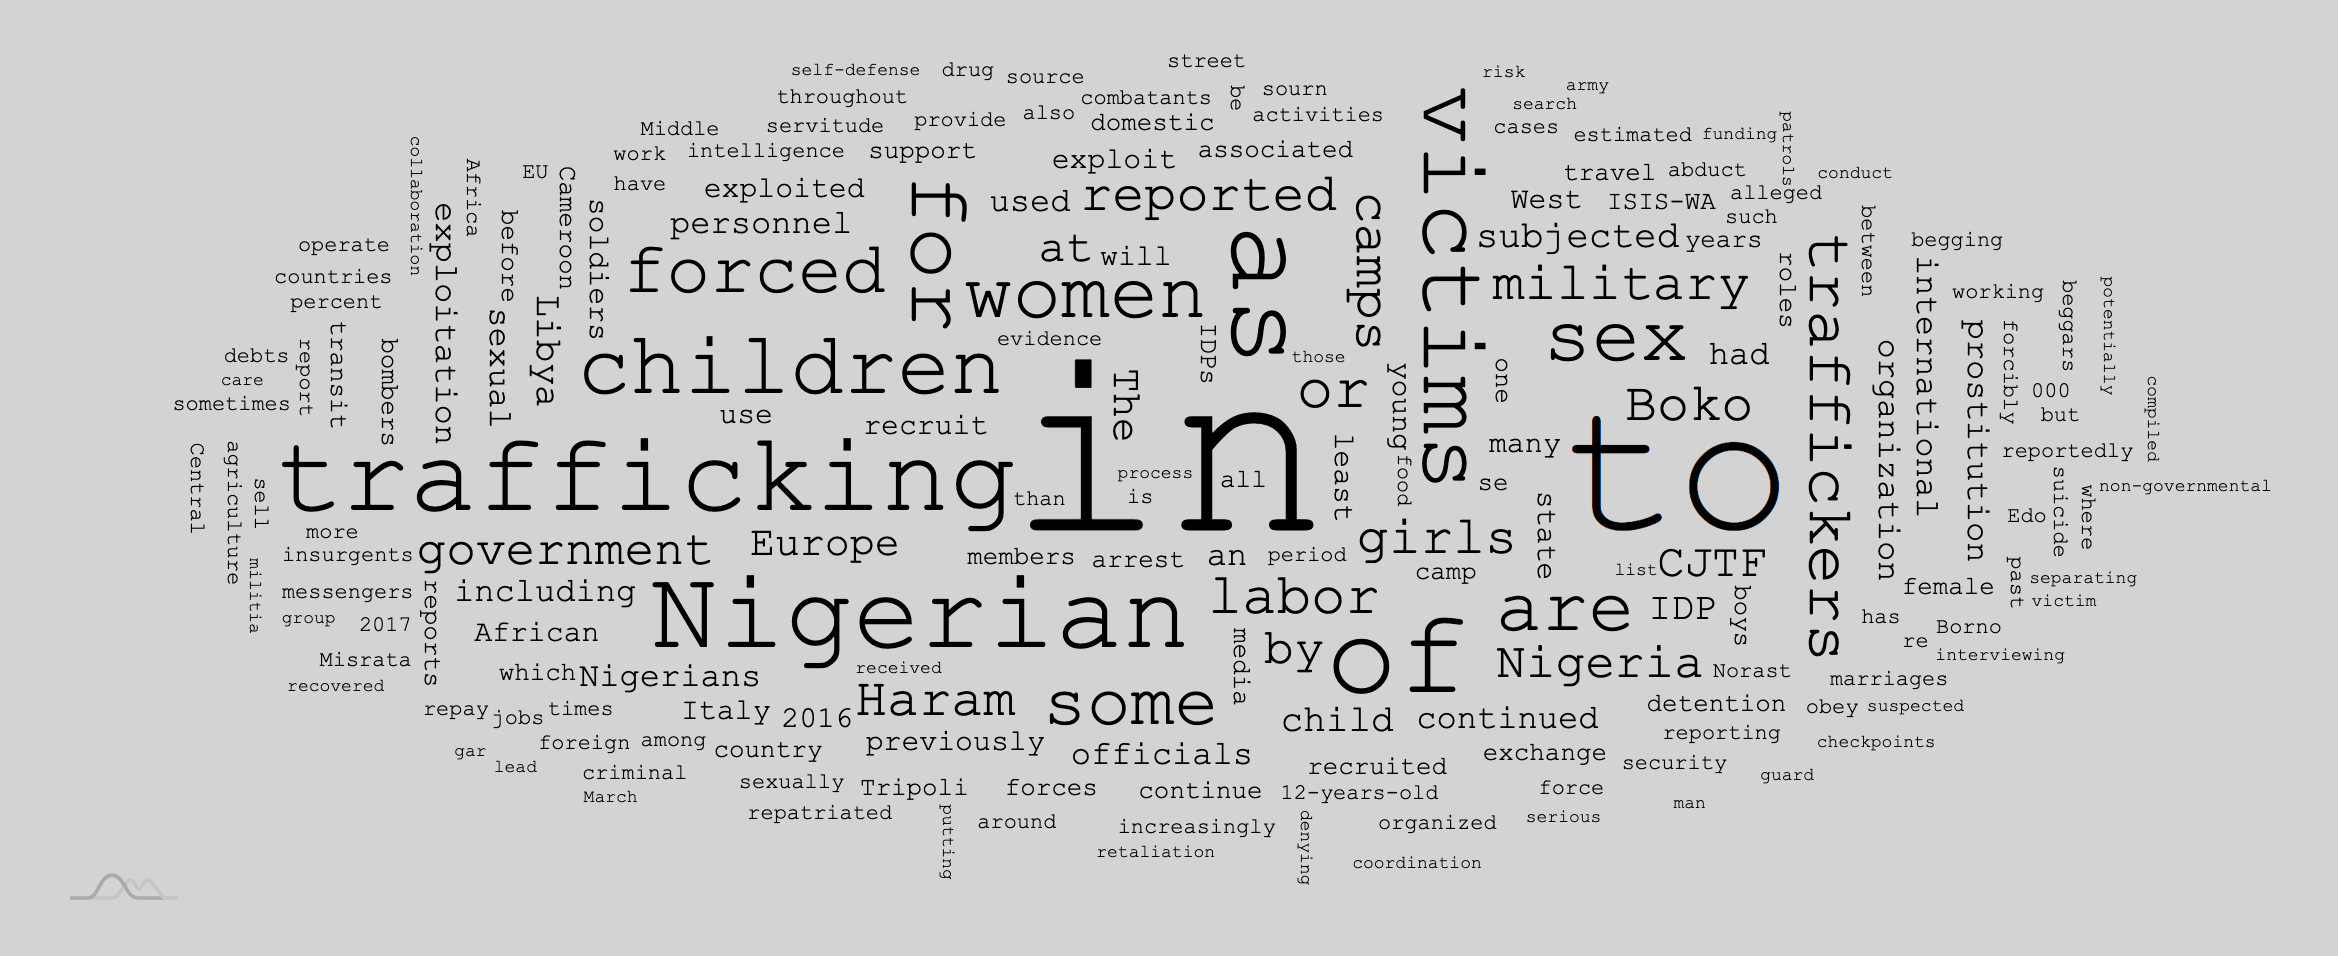
Word cloud of the most frequent words associated with human trafficking in each country;
-
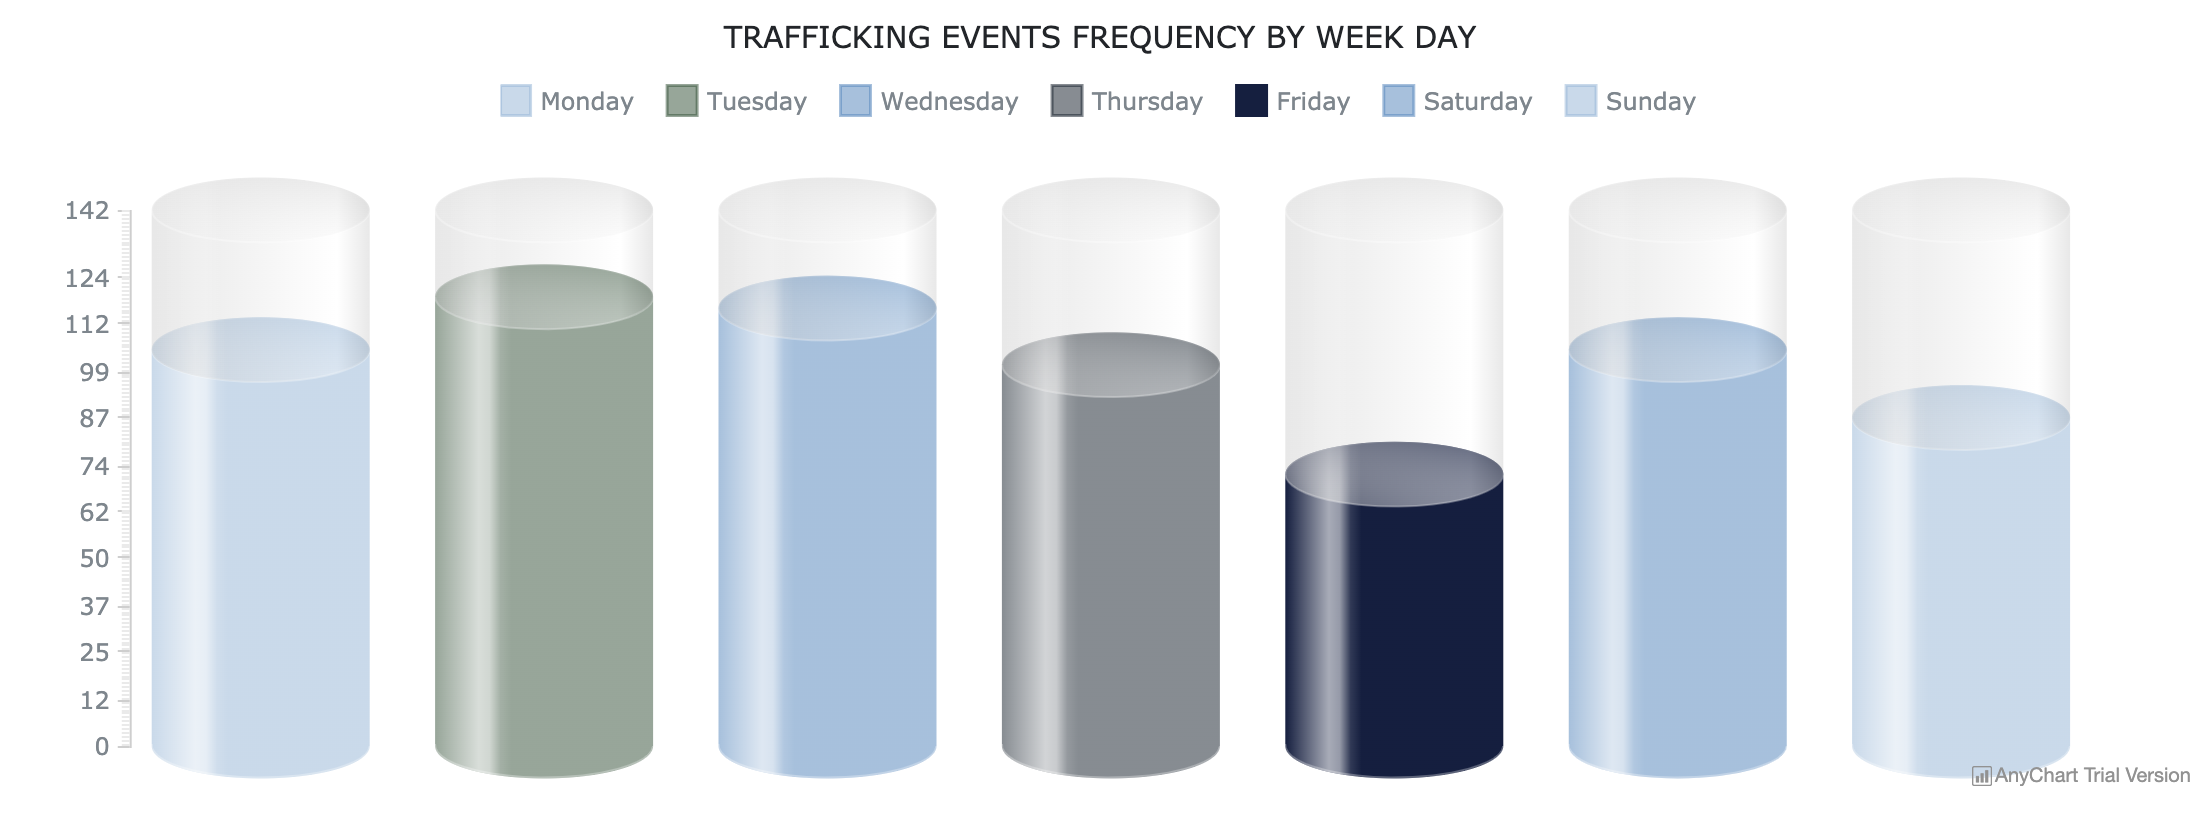
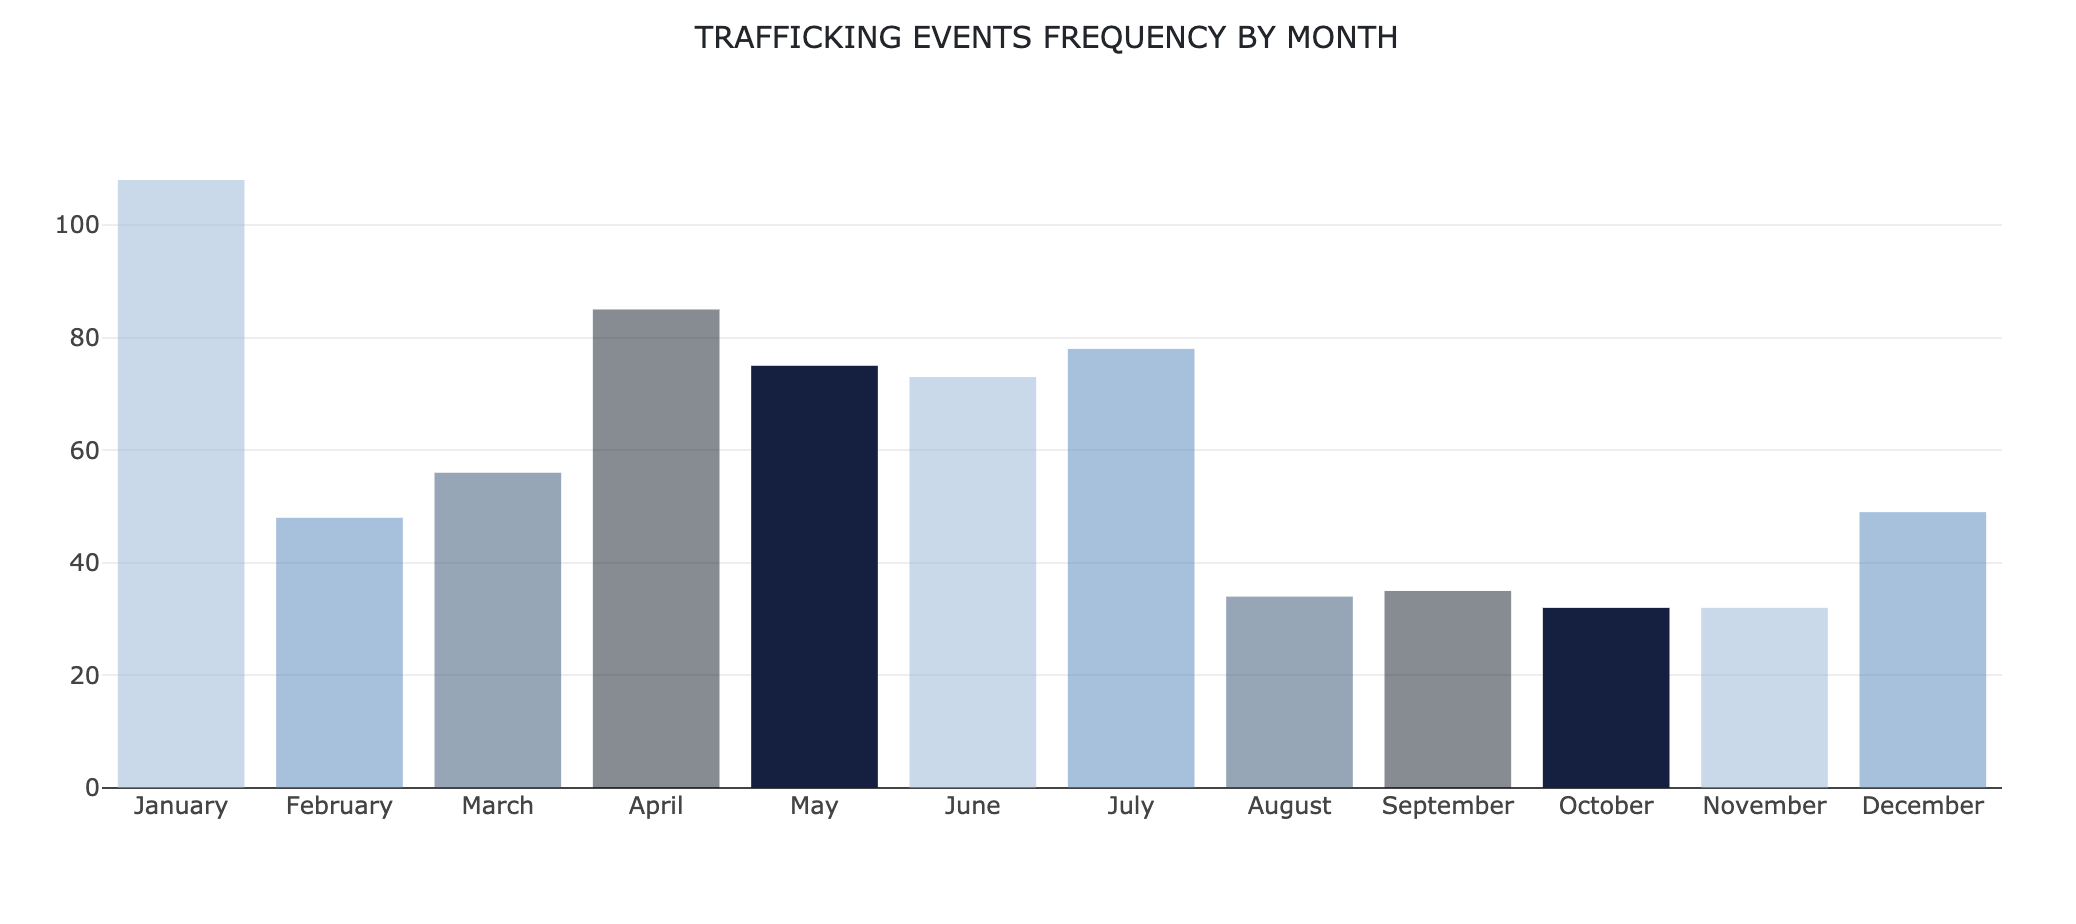
Bar charts and gauge tanks to show frequency of human trafficking events by days and months;
-
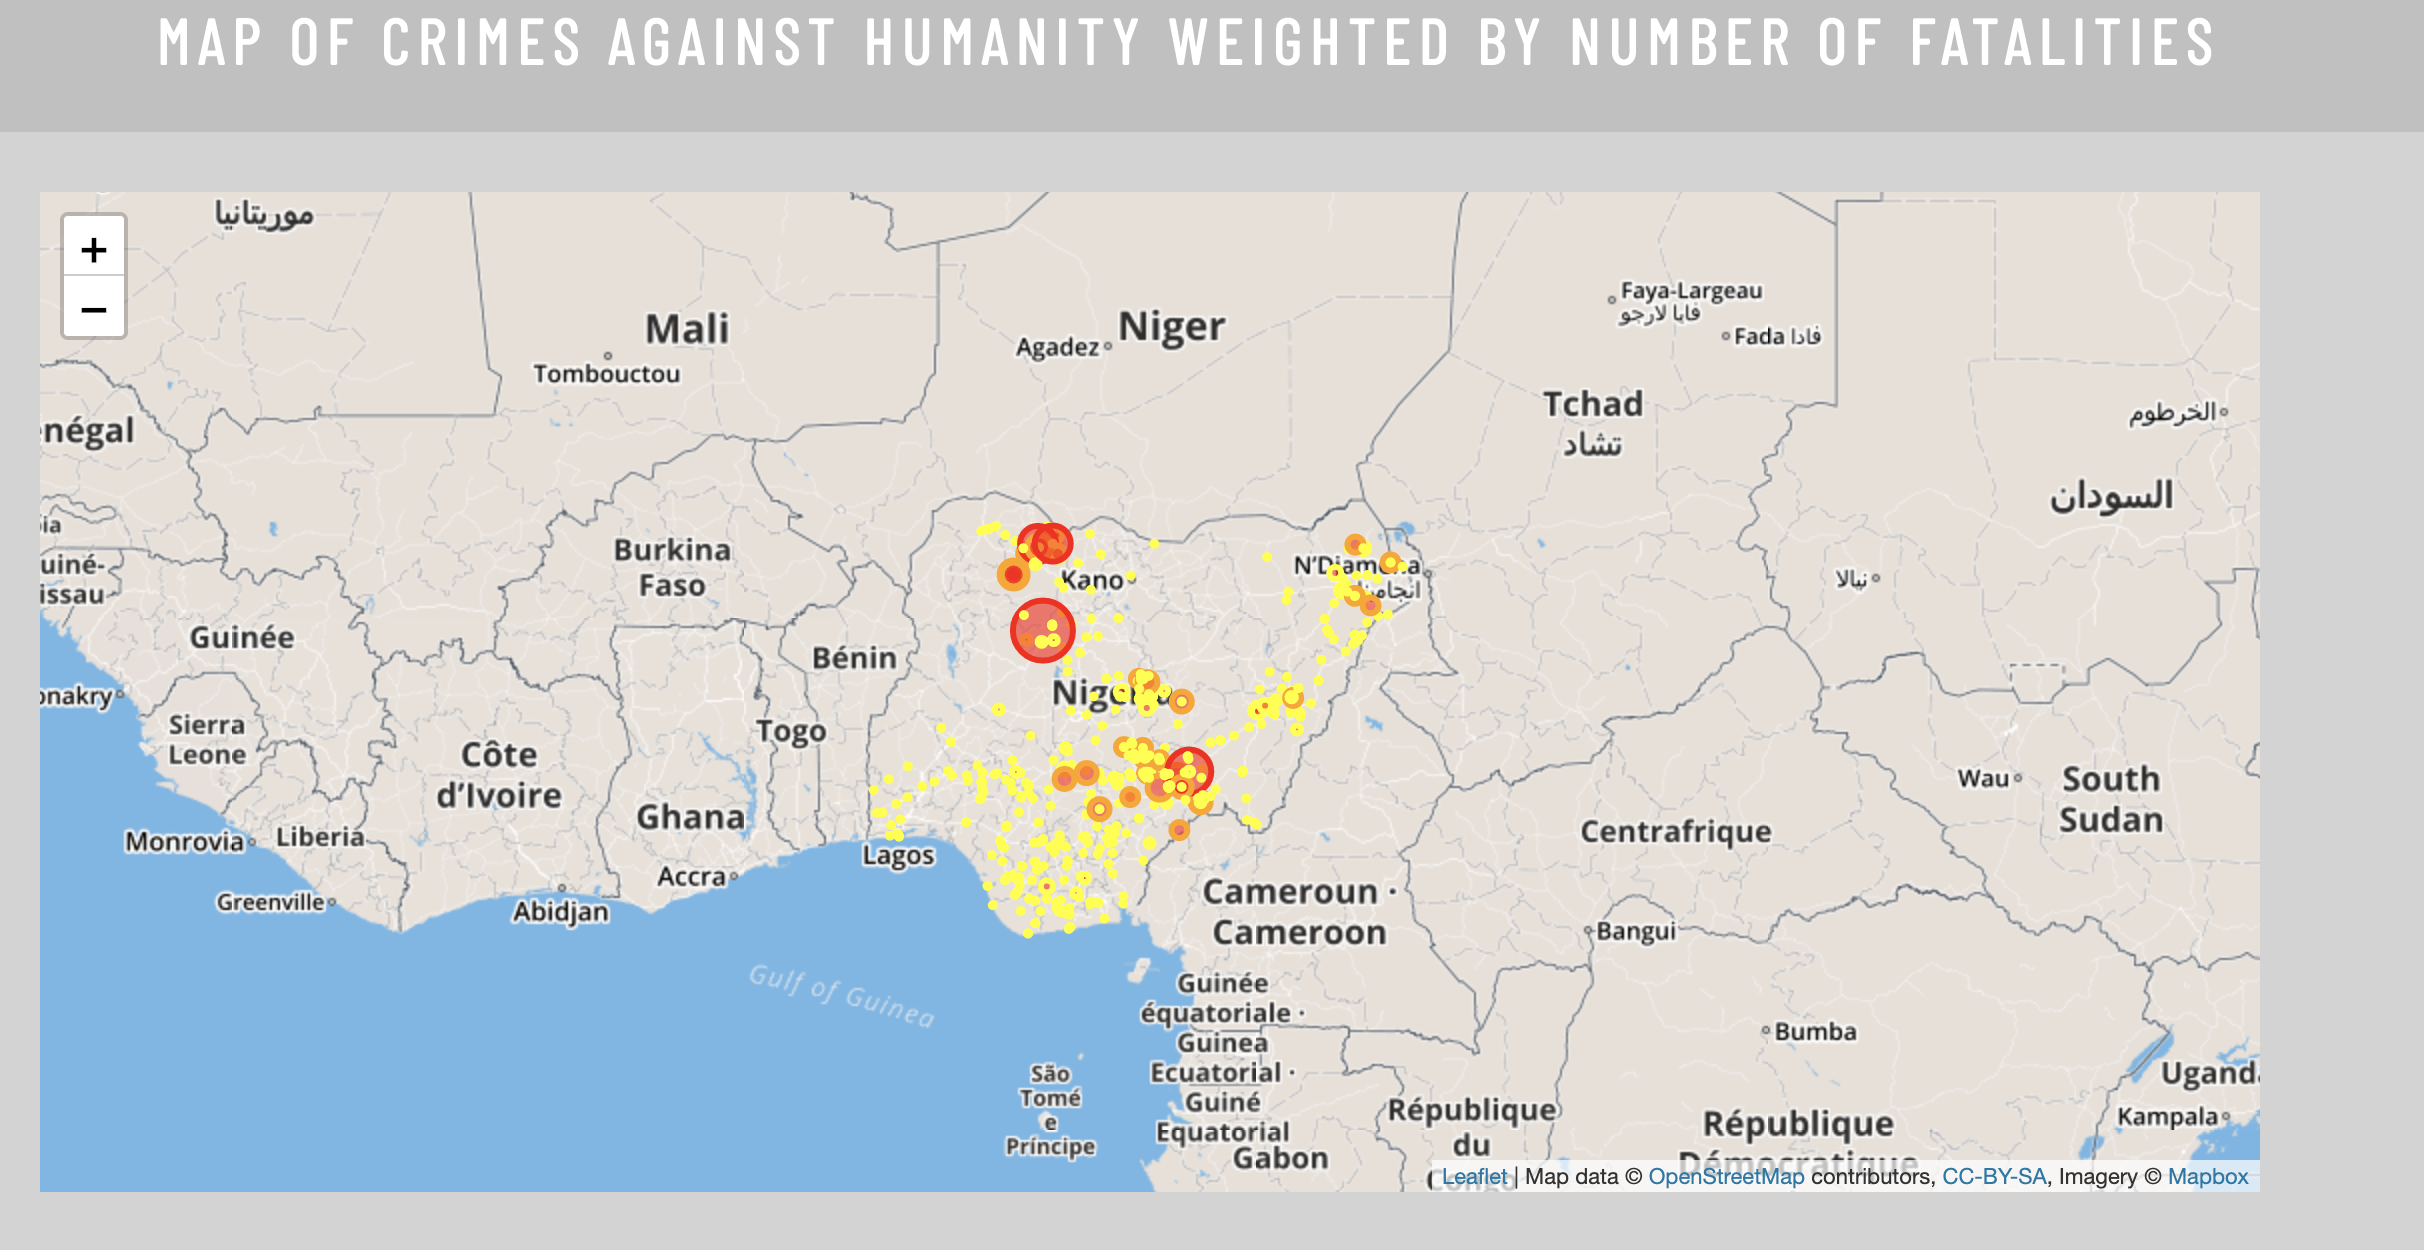
Map of conflicts related to human trafficking events in each country weighted by number of fatalities;
-
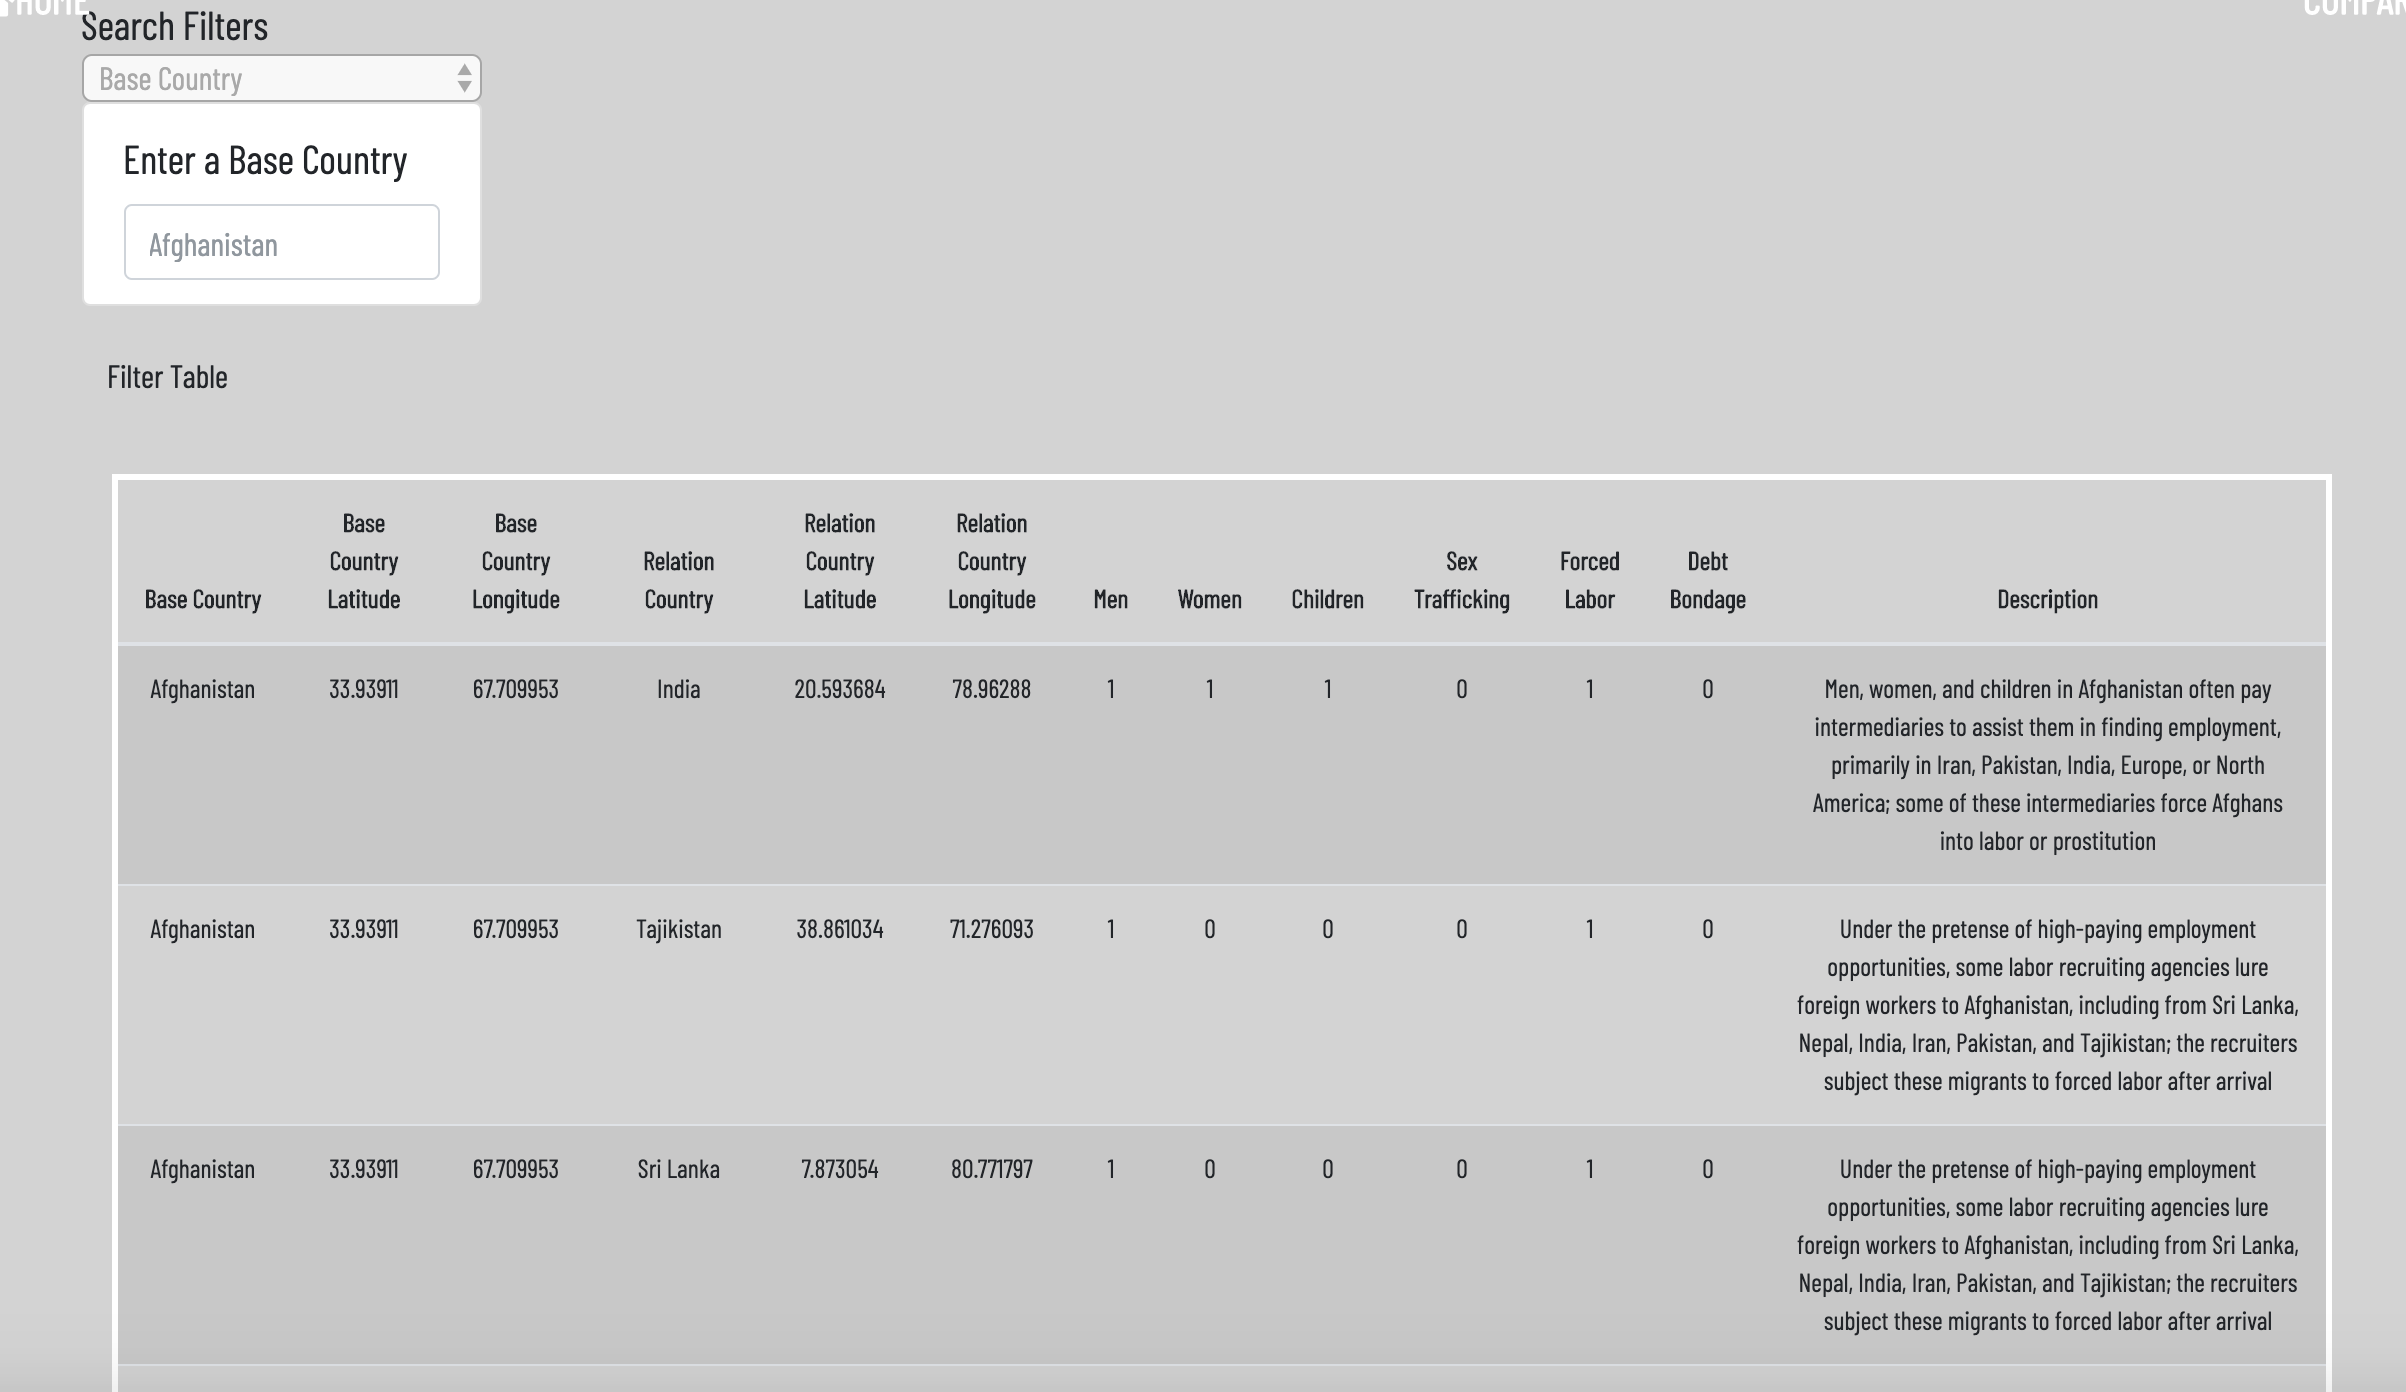
Data page to allow users interract with the dataset used to build the charts.
The gauge chart, world cloud, map of conflicts , bar charts and gauge tanks were updated any time that a new country is selected via a dropdown.
-
D3.js
-
Plotly.js
-
Leaflet.js
-
Anychart.js
-
Mapbox.js
-
Amcharts.js
Deployed the app to GitHub's free static page hosting service.
