Monitor devices on your Altibox network.
This prometheus exporter will connect to the Altibox website, get information on devices connected to your network and make them available for Prometheus.
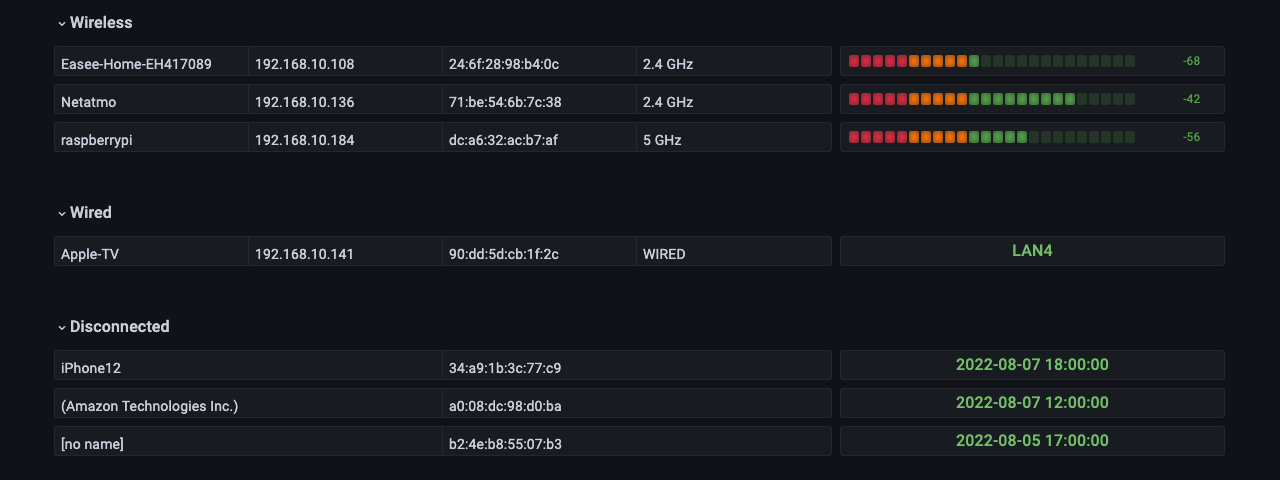
See the provided Grafana dashboard for examples on how the data can be used.
Docker image is available on ghcr.io.
docker run -d -p 8080:8080 --restart always -e ALTIBOX_USER=... -e ALTIBOX_PASSWORD=... ghcr.io/terjesannum/altibox-network-exporter:5Note: Altibox seems to only support one active user session, so don't run multiple instances of this exporter.
# HELP altibox_network_client Connection status of network client
# TYPE altibox_network_client gauge
altibox_network_client{connected_to="",connection="DISCONNECTED",ip="192.168.1.142",mac="a0:02:dc:29:f1:ba",manufacturer="Amazon Technologies Inc.",name="",port=""} 0
altibox_network_client{connected_to="VMG8825-B50B (54:83:3a:80:6e:a5)",connection="WIFI24GHZ",ip="192.168.1.108",mac="24:6f:28:98:b4:0c",manufacturer="",name="Easee-Home-EH417089",port=""} 1
altibox_network_client{connected_to="VMG8825-B50B (54:83:3a:80:6e:a5)",connection="WIFI5GHZ",ip="192.168.1.184",mac="dc:a6:32:ca:7b:a3",manufacturer="",name="raspberrypi",port=""} 1
altibox_network_client{connected_to="VMG8825-B50B (54:83:3a:80:6e:a5)",connection="WIRED",ip="192.168.1.141",mac="90:dd:5d:cb:1f:2c",manufacturer="",name="Apple-TV",port="LAN4"} 1
# HELP altibox_network_client_wifi_rssi Signal strength of connected wifi client
# TYPE altibox_network_client_wifi_rssi gauge
altibox_network_client_wifi_rssi{connected_to="VMG8825-B50B (54:83:3a:80:6e:a5)",connection="WIFI24GHZ",ip="192.168.1.108",mac="24:6f:28:98:b4:0c",manufacturer="",name="Easee-Home-EH417089"} 64
altibox_network_client_wifi_rssi{connected_to="VMG8825-B50B (54:83:3a:80:6e:a5)",connection="WIFI5GHZ",ip="192.168.1.184",mac="dc:a6:32:ca:7b:a3",manufacturer="",name="raspberrypi"} 40
As metrics are collected on demand from Altibox' servers, don't scrape the exporter too often and tolerate slow response. Example scrape config:
- job_name: altibox-network-exporter
  scrape_interval: 1m
  scrape_timeout: 50s
  static_configs:
    - targets: ['localhost:8080']