CIS565 Final Project, Terry Sun & Sally Kong
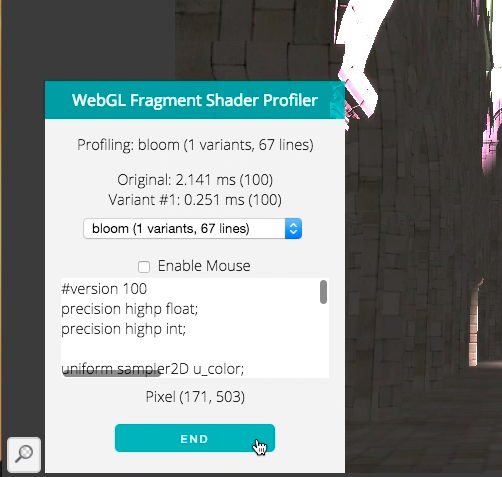
There are many tools for profiling JavaScript/WebGL applications, but none (?) which profile the actual shaders. However, shaders can end up doing quite a bit of heavy lifting, and we want to minimize the amount of time they take so Javascript can have all of the fun.
Thus, we have built a Chrome extension for profiling fragment shaders. This runs on a webpage, access the GLSL programs running on it, and profile the fragment shader(s) over different pixels. (See below for more information!)
Inspiration for hijacking WebGLContexts was found by looking at Chrome Shader Editor Extension and WebGL Inspector. (All code in this repository was written by us.)
Thanks to Patrick Cozzi and Kai Ninomiya for teaching and TAing (respectively) CIS565.
This extension relies on the WebGL ext_disjoint_timer_query extension, which is currently only available on pre-release version of Chrome (Chrome Canary or Chromium). Additionally, you need to enable WebGL draft extensions at "chrome://flags". You should check that "EXT_disjoint_timer_query" is listed at http://webglreport.com/.
Then:
- Download this git repository:
git clone https://github.com/terrynsun/WebGL-Fragment-Shader-Profiler.git. - Go to
chrome://extensionsand enable Developer Settings (top right corner). - Click "Load unpacked extension" and select
srcfrom this repo. - Find a WebGL app to play with! The extension will show itself as an icon in the bottom left.
Caveat: still under development! Not super stable. Please don't be sad if this crashes.
This Chrome extension injects JavaScript into a webpage, which...
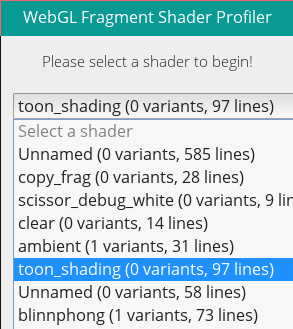
- Inserts a panel into the page, where you can select individual shaders for profiling.
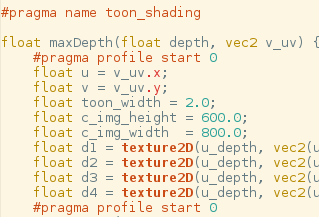
- Can profile impact of different sections of the shader by disabling
user-indicated blocks of code. (User markup denoted with
#pragmalines.) - Auto-profling with options such as "disable all
texture2Dcalls". (Which is, right now, the only option...) - Can profile just a section of the canvas by mousing over the target region.
A "shader variant" is a modified user-uploaded shader, with some of its potentially expensive computational calls replaced with no-ops.
Using the saved shader sources, we can search and modify the uploaded shader
source code. Shader variants are surrounded by #pragma profile start 0 and
#pragma profile end 0 (with some value of 0 between 0-9). GLSL code within
the block will be replaced with no-ops (eg. texture2D => vec4(0)), and the
shader will be re-compiled.
In order to run shader variants with the same data as the original, texture and uniform binding GL calls are "cascaded" from the original program to all of its associated variants when they are made, such that each variant runs with the same set of uniforms as its original program. Thus, the only difference between the original shader and any of its variants is the difference in code.
Additionally, there is an option that will automatically replace all texture2D
calls with no-ops. (More such options may be available in the future?)
When mouseover is enabled, the profiler will restrict drawing to a small portion of the canvas surrounding the mouse, and will report shader timing accordingly. The profiler will reset whenever the mouse is moved, so one can easily check different parts of the shader.
On a draw call, this queries the WebGL context for any existing GLScissor configuration. If one exists, the profiler will re-compute a scissor bound by taking the intersection of the mouse-selected area and the existing scissor box. (If no intersection exists, the draw will simply be skipped.)
This reveals differences in performance between different portions of the shader. For example, a program with complicated geometry in one only portion of the canvas.
![] (img/mouse_selection.gif)
This extension overwrites several functions in WebGLRenderingContext before
the page is loaded in order to get access to the GL state of the page.
By overwriting createShader, shaderSource, createProgram, attachShader, we
can obtain (and store) a list of shaders (and their sources) and programs (and
their shaders).
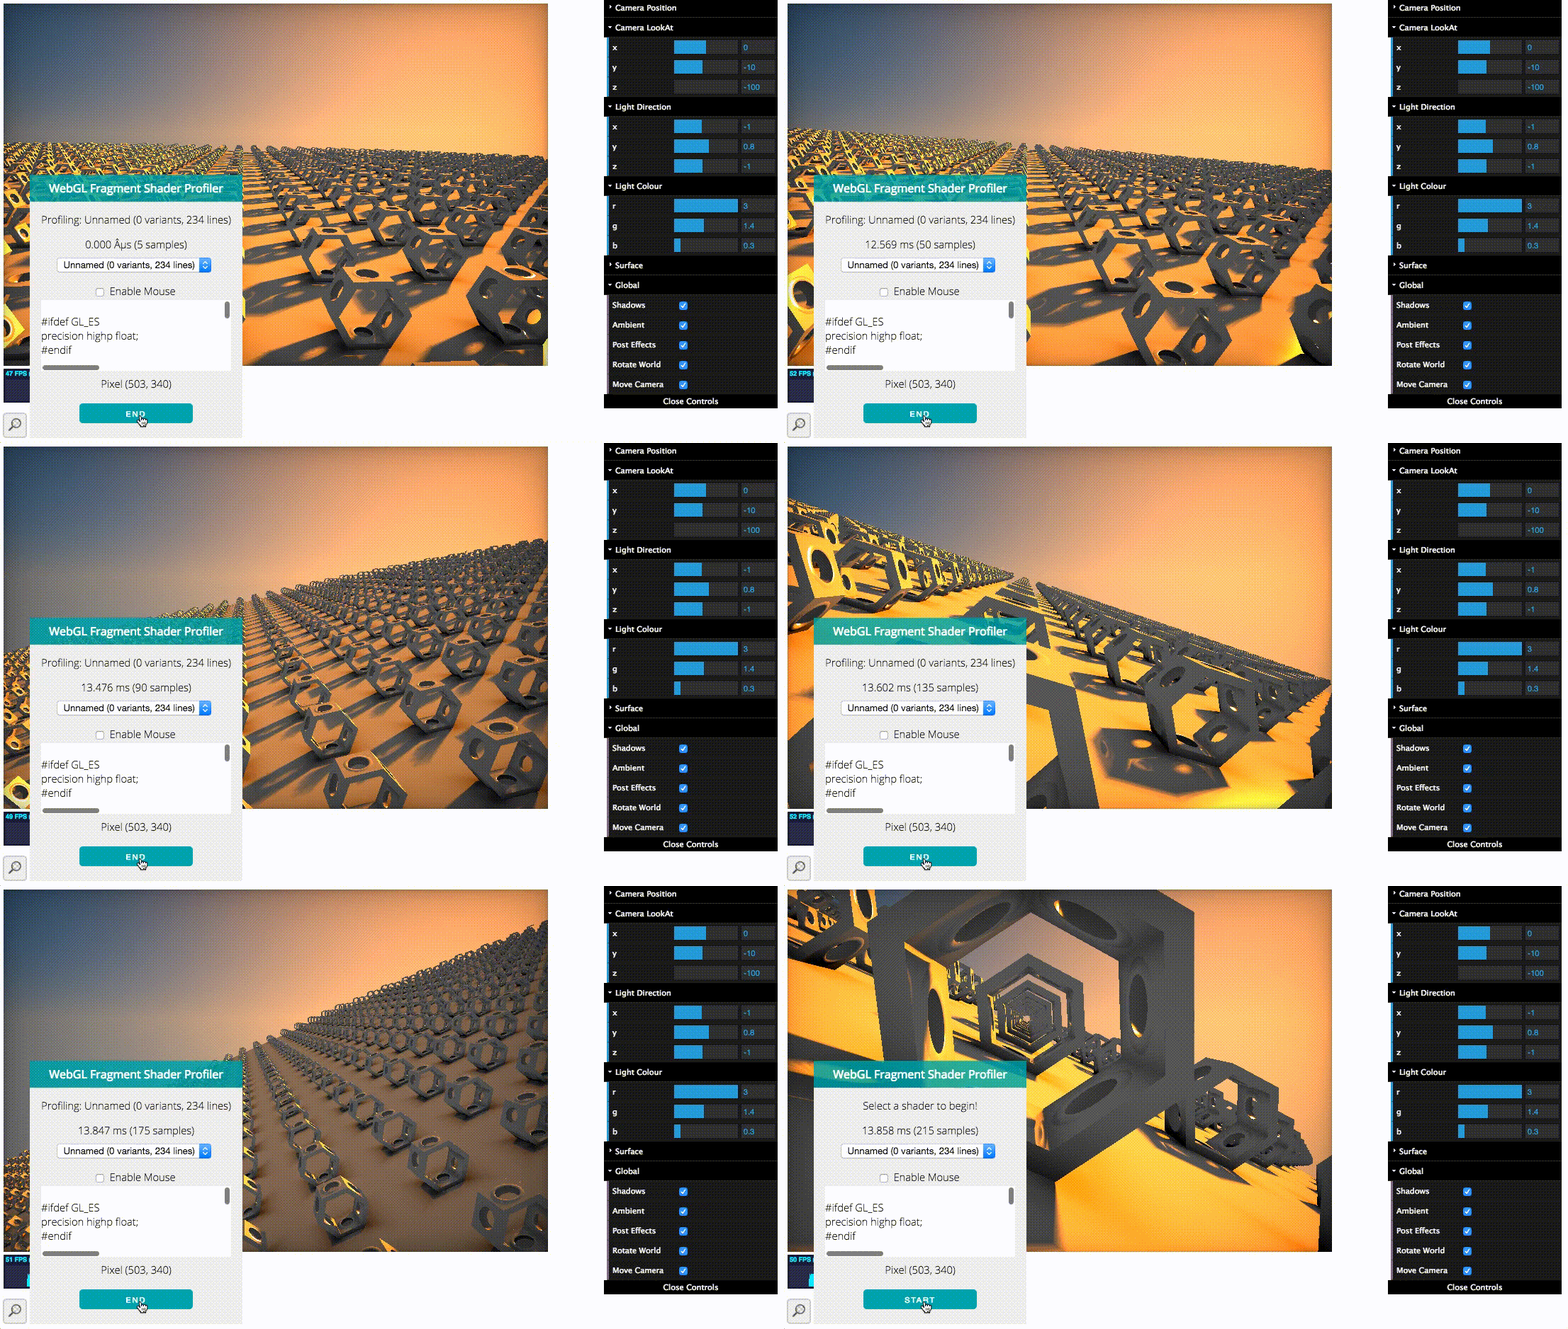
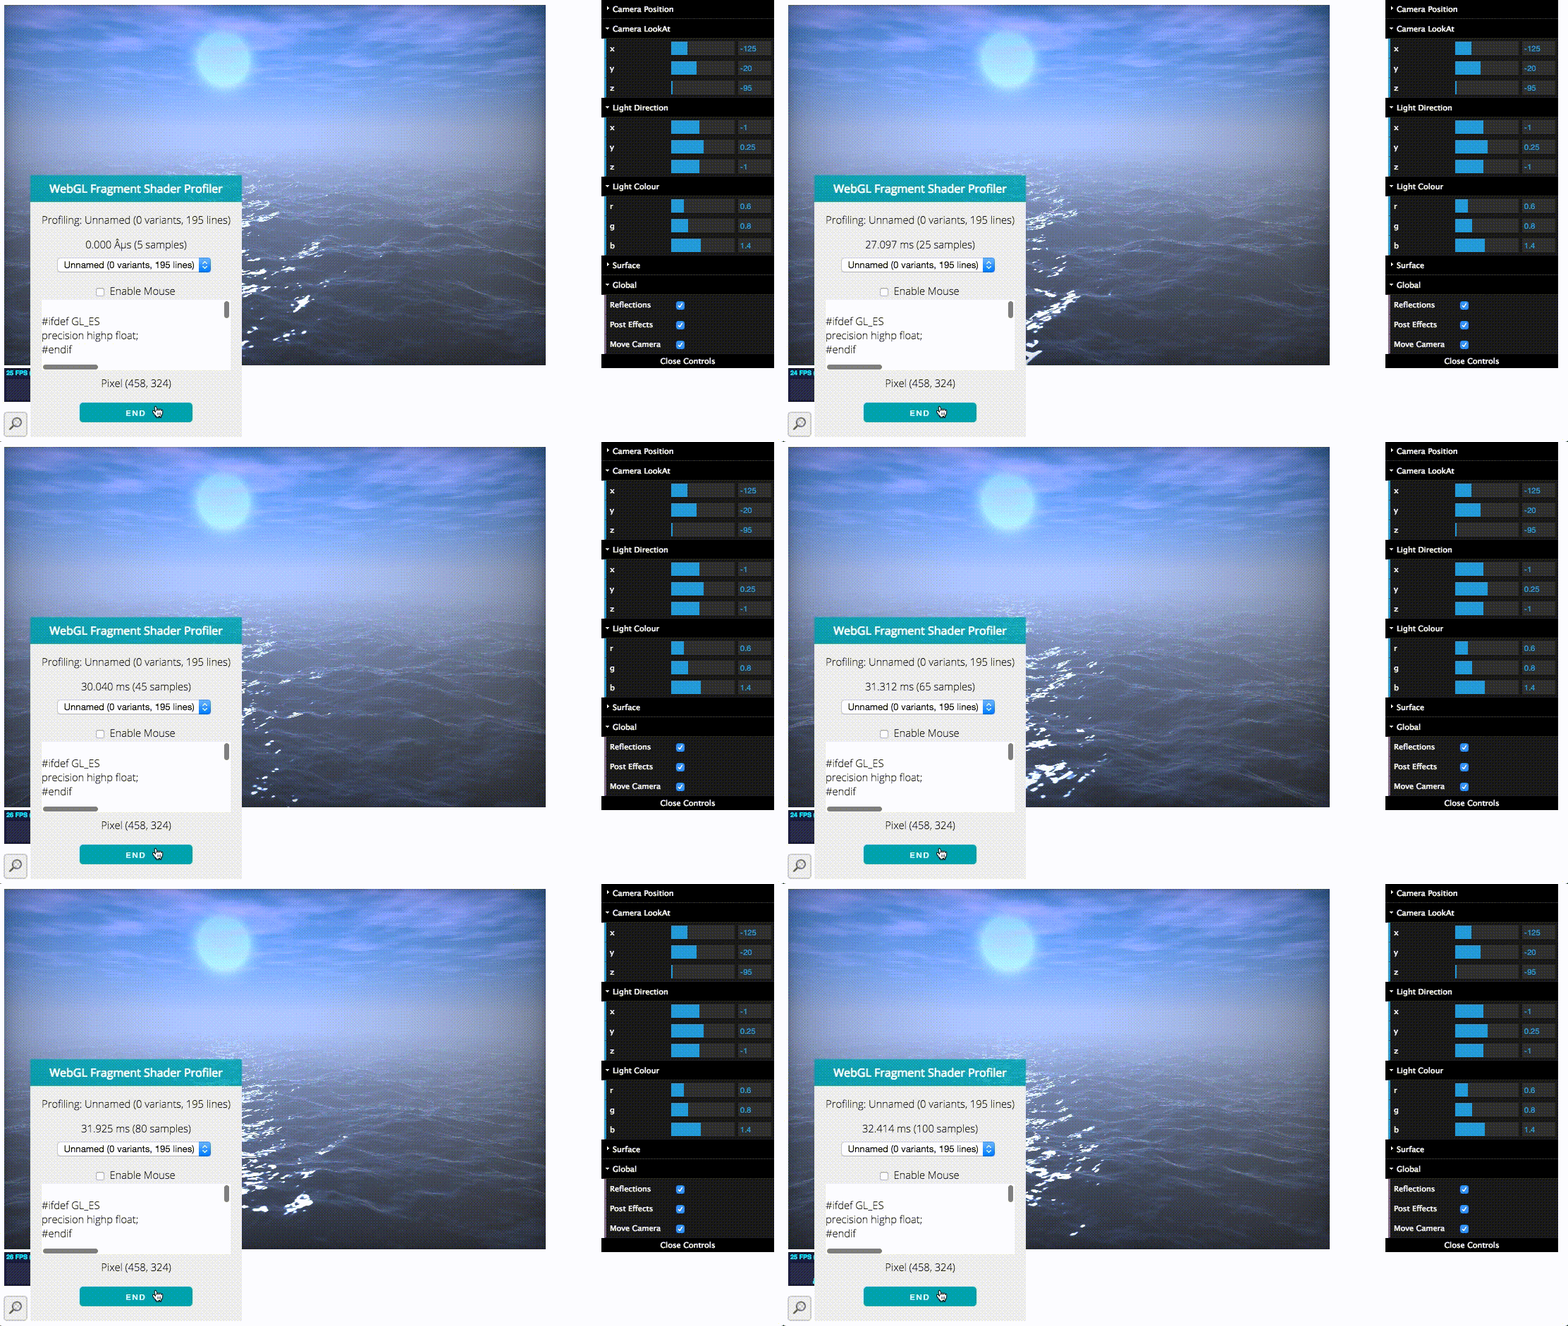
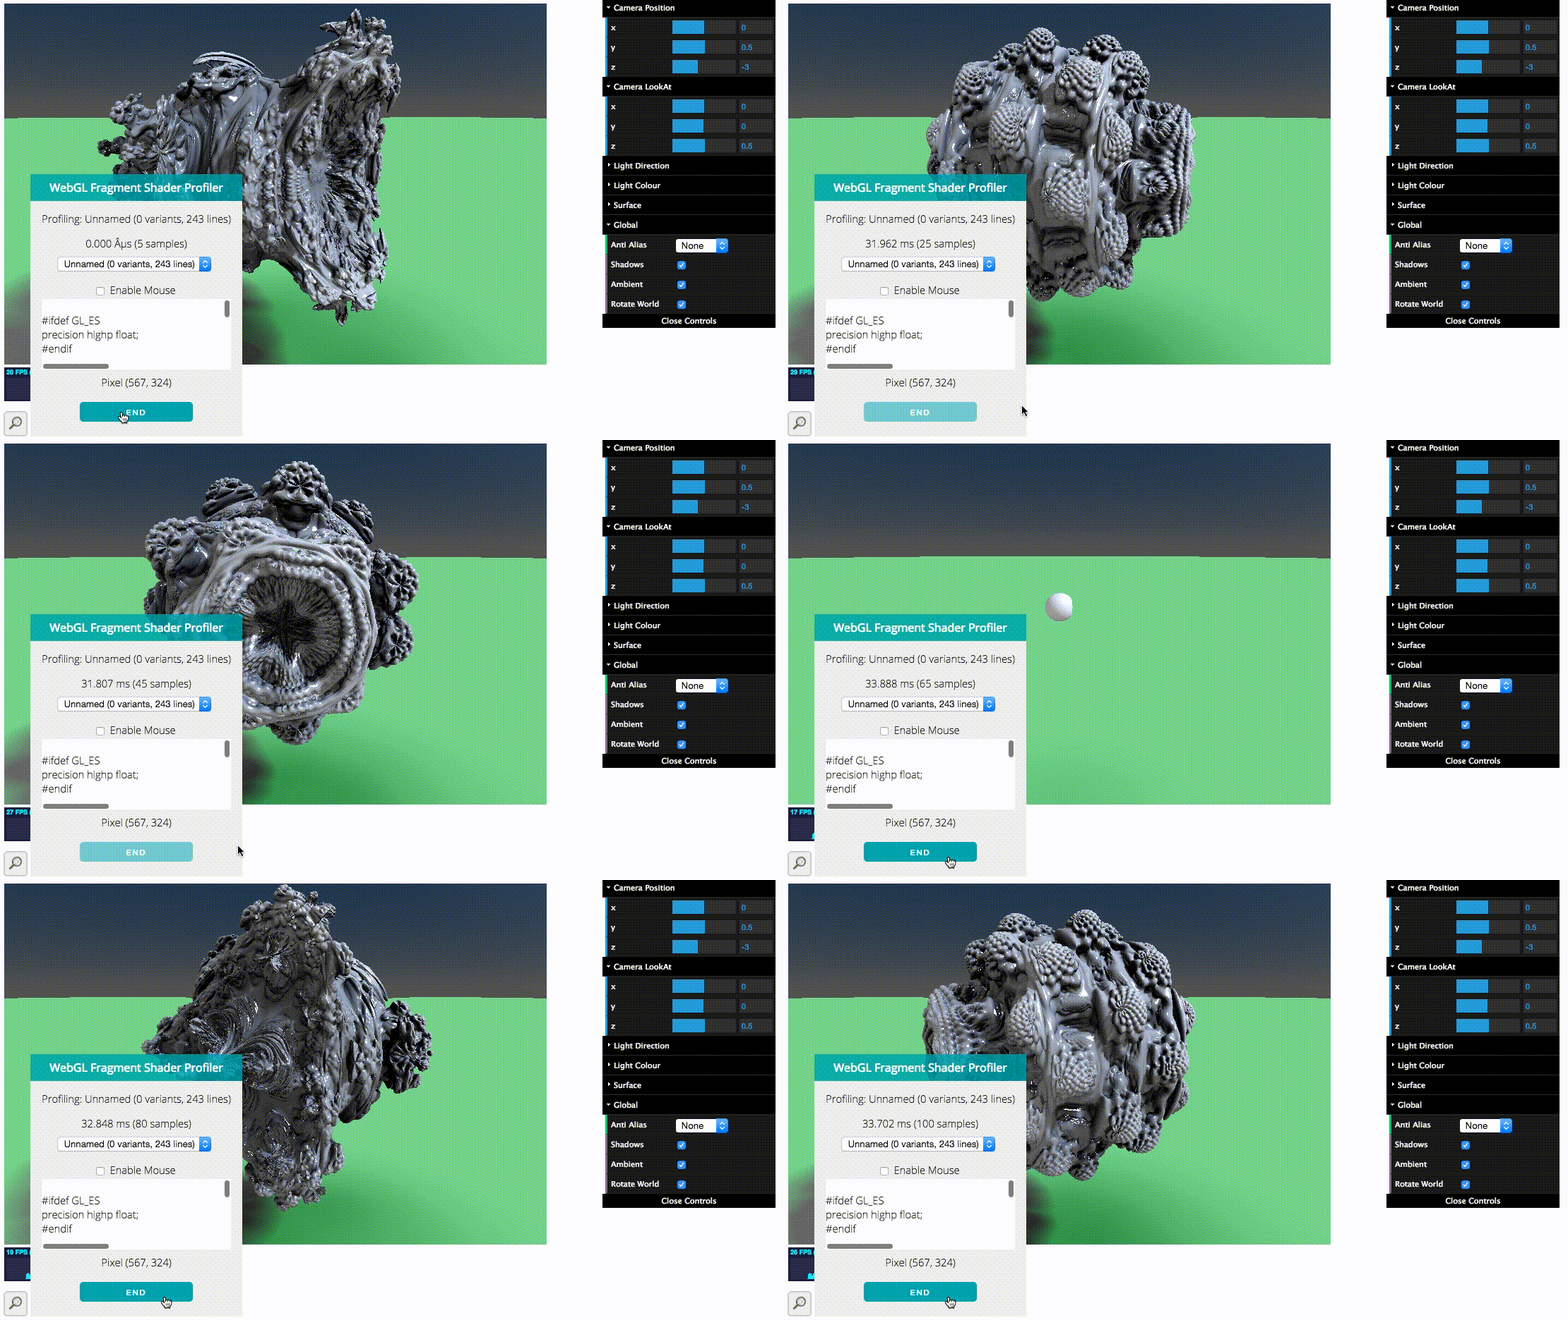
Profiling (no variants) some shader experiments from kevs3d:
| Distance Field | Distance Field Waves | Mandelbulb | Animated CSG Shape |
|---|---|---|---|
 |
 |
 |
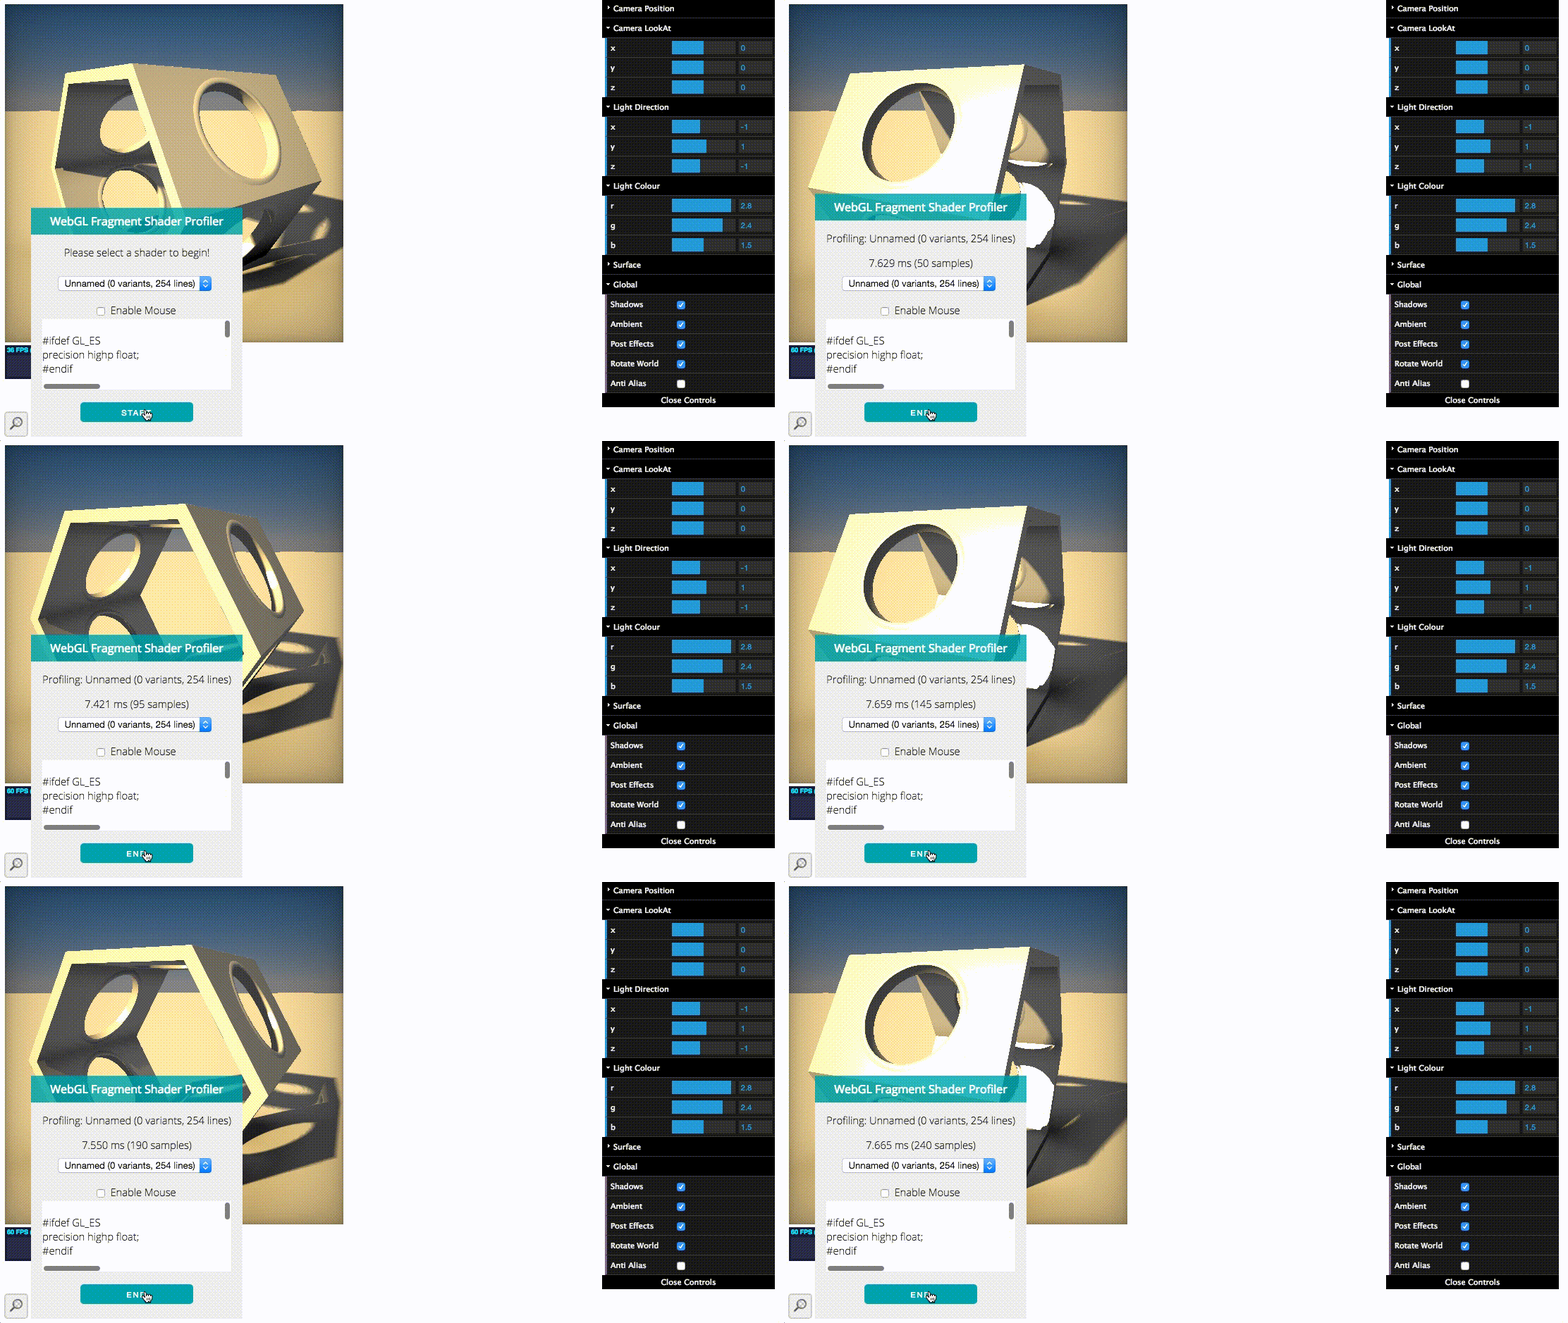 |
| 13.5 ms | 32.4 ms | 33.8 ms | 7.5 ms |
Many of these shaders have disparate parts. Try mousing over the sky vs. waves (distance field waves), on vs. off the object (Mandelbulb).
Effect of replacing texture2D calls with no-ops, in a deferred shader (by Megan Moore). This shows the various effects that texture accesses may cause, which are much higher in a bloom filter (which must access dozens of nearby pixels, for each pixel) and lower for an ambient-lighting shader (which needs to do only one texture access).
![] (img/graph.png)
A todo section, for the Future. Suggest more!
- Add additional pre-built options, e.g. "disable all texture2D calls".
- Generate more than one shader variant at a time. (WIP-ish).
- Be able to run on more WebGL apps (e.g. currently crashes on many three.js demos, does not work on Shadertoy).
- Live-editing with ShaderEditor
- Make sure to load everything in order (sometimes an error is thrown because JS is loaded out of order).
- Include an option to re-check the page for a Canvas element. (WIP).
Class presentations can be found here:
