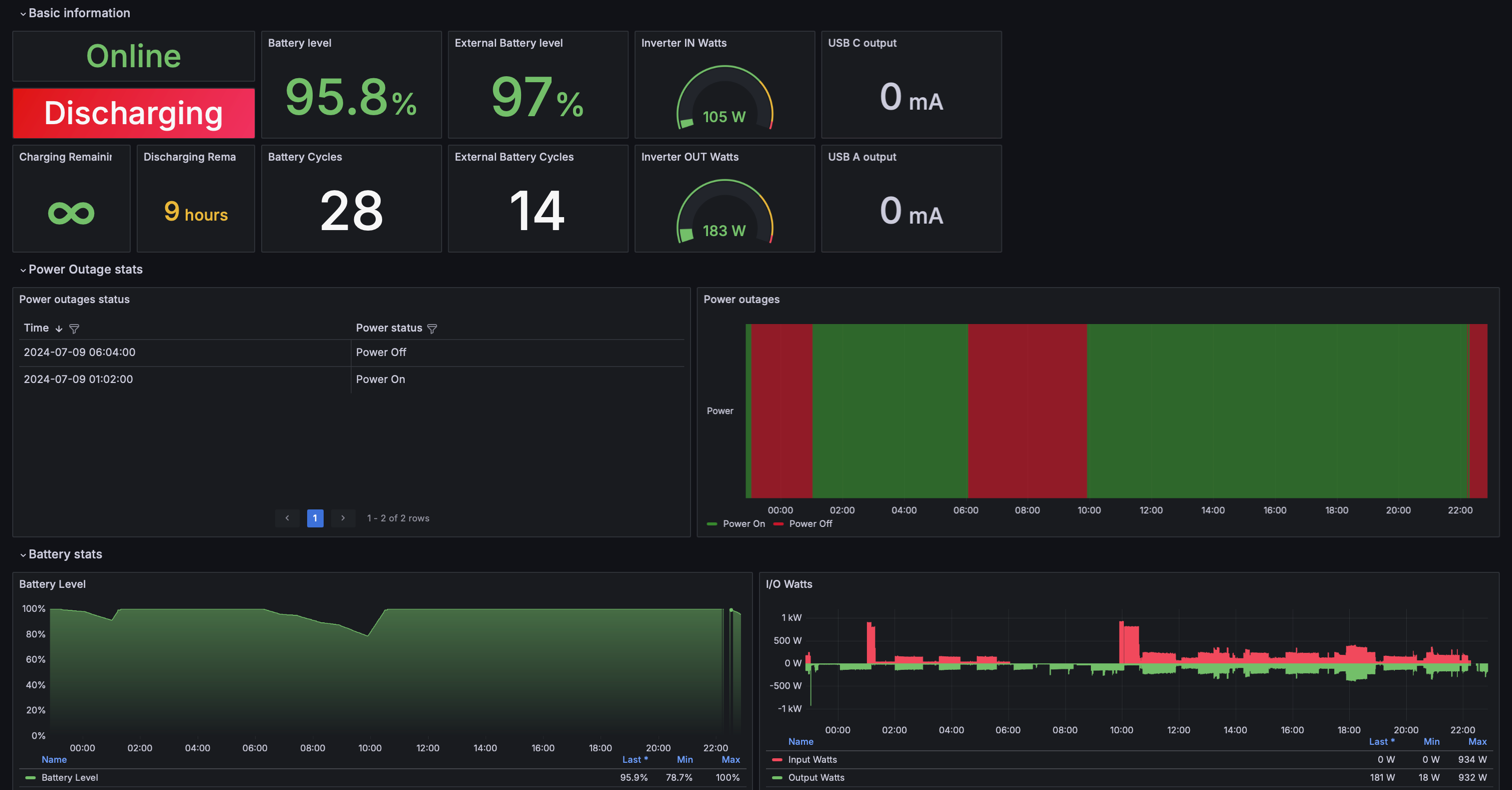
This is an Ecoflow metrics exporter different target systems implemented in Go. Currently, the supported target systems are:
- Prometheus
- TimescaleDB
- Redis
Depending on your configuration you can export the metrics to one of those systems or to all at once.
You can select one of two ways how to fetch data from your Ecoflow devices:
- Using Ecoflow Rest API
- Using MQTT
This project uses library https://github.com/tess1o/go-ecoflow to fetch the metrics from your Ecoflow devices via either REST API or MQTT
Follow this guide Quickstart to run the exporter via MQTT and Prometheus
This is required if you want to use Ecoflow Rest API. For MQTT only Ecoflow username(email) and password are required
- Go to https://developer-eu.ecoflow.com/
- Click on "Become a Developer"
- Login with your Ecoflow username and Password
- Wait until the access is approved by Ecoflow
- Receive email with subject "Approval notice from EcoFlow Developer Platform". May take some time
- Go to https://developer-eu.ecoflow.com/us/security and create new AccessKey and SecretKey
See documentation here: Prometheus
See documentation here: TimescaleDB TimescaleDB allows to build more complex logic if you want so. For instance, you can calculate how long you had power outages and how long the grid power was on. Since all metrics are stored in a PostgreSQL database (TimescaleDB to be precise), you have the power of SQL to build any kind of metrics or reports you want. Prometheus doesn't provide such flexibility.
See documentation here: Redis
This implementation is inspired by https://github.com/berezhinskiy/ecoflow_exporter, and it's fully
compatible with their grafana dashboard. This exporter by default uses the same prefix for the metrics (ecoflow)
Both exporters support all parameters returned by the API. MQTT and Rest API actually return the same set of parameters.
This implementation was tested on Delta 2 and River 2.
Some difference between this project and https://github.com/berezhinskiy/ecoflow_exporter:
- This project supports exporting parameters via Ecoflow Rest API or MQTT.
- If you use exporter via Ecoflow Rest API then you don't need to hard code Device Serial Numbers and this exporter can export metrics from all linked devices. MQTT exporter on the other hand requires the list of devices. However, you can specify all required devices separated by comma and this exporter will do the rest. https://github.com/berezhinskiy/ecoflow_exporter can export metrics for a single device only, and you have to hardcode it's Serial Number in the env variables. If you have 5 devices, then you need to run 5 instances of the exporter
- This exporter supports sending metrics to Prometheus, TimescaleDB or Redis. https://github.com/berezhinskiy/ecoflow_exporter supports Prometheus only.
- The image size (not compressed!) of this exporter is only 28MB,
ghcr.io/berezhinskiy/ecoflow_exporteris 142 MB. This exporter supports both REST API and MQTT, sending data to Prometheus, Redis, TimescaleDB - This implementation is extremely lightweight and barely consumes any RAM & CPU (it needs less than 10MB of RAM to fetch metrics from 2 devices)
