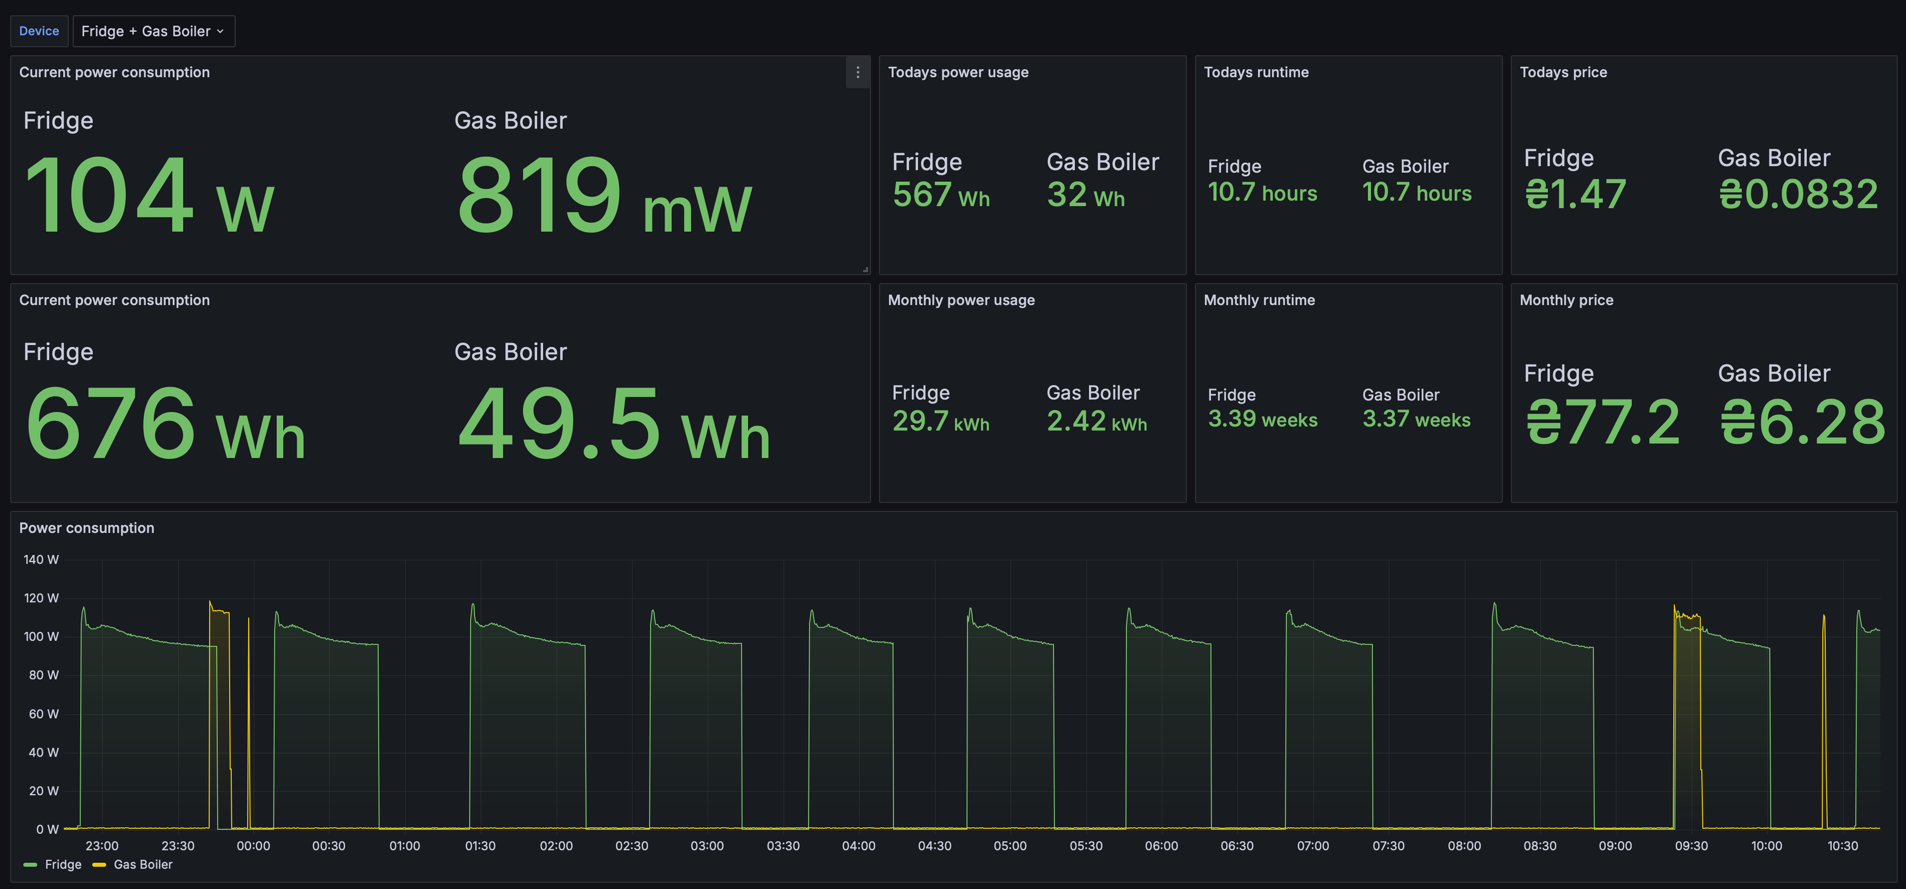
This is an TP-Link Tapo P110 Prometheus exporter written in Go. It collects the data from P110 devices and sends them to Prometheus, where they can be visualized in Grafana.
This exporter handles 403 errors that are randomly are received from P110 devices.
cd docker-compose- Update
TAPO_EMAILandTAPO_PASSWORDindocker-compose.ymlor use environment variables (preferable) - Update
config.jsonand add P110 devices with meaningful names and their IP addresses (or host:port, see below how to configure everything to work via Internet) - Run
docker compose upordocker compose up -d
The exporter is running on port 8086, Prometheus on port 9090 and Grafana on port 3000.
Go to Grafana (http://localhost:3000, admin/admin), configure Prometheus datasource (url should
be http://prometheus:9000).
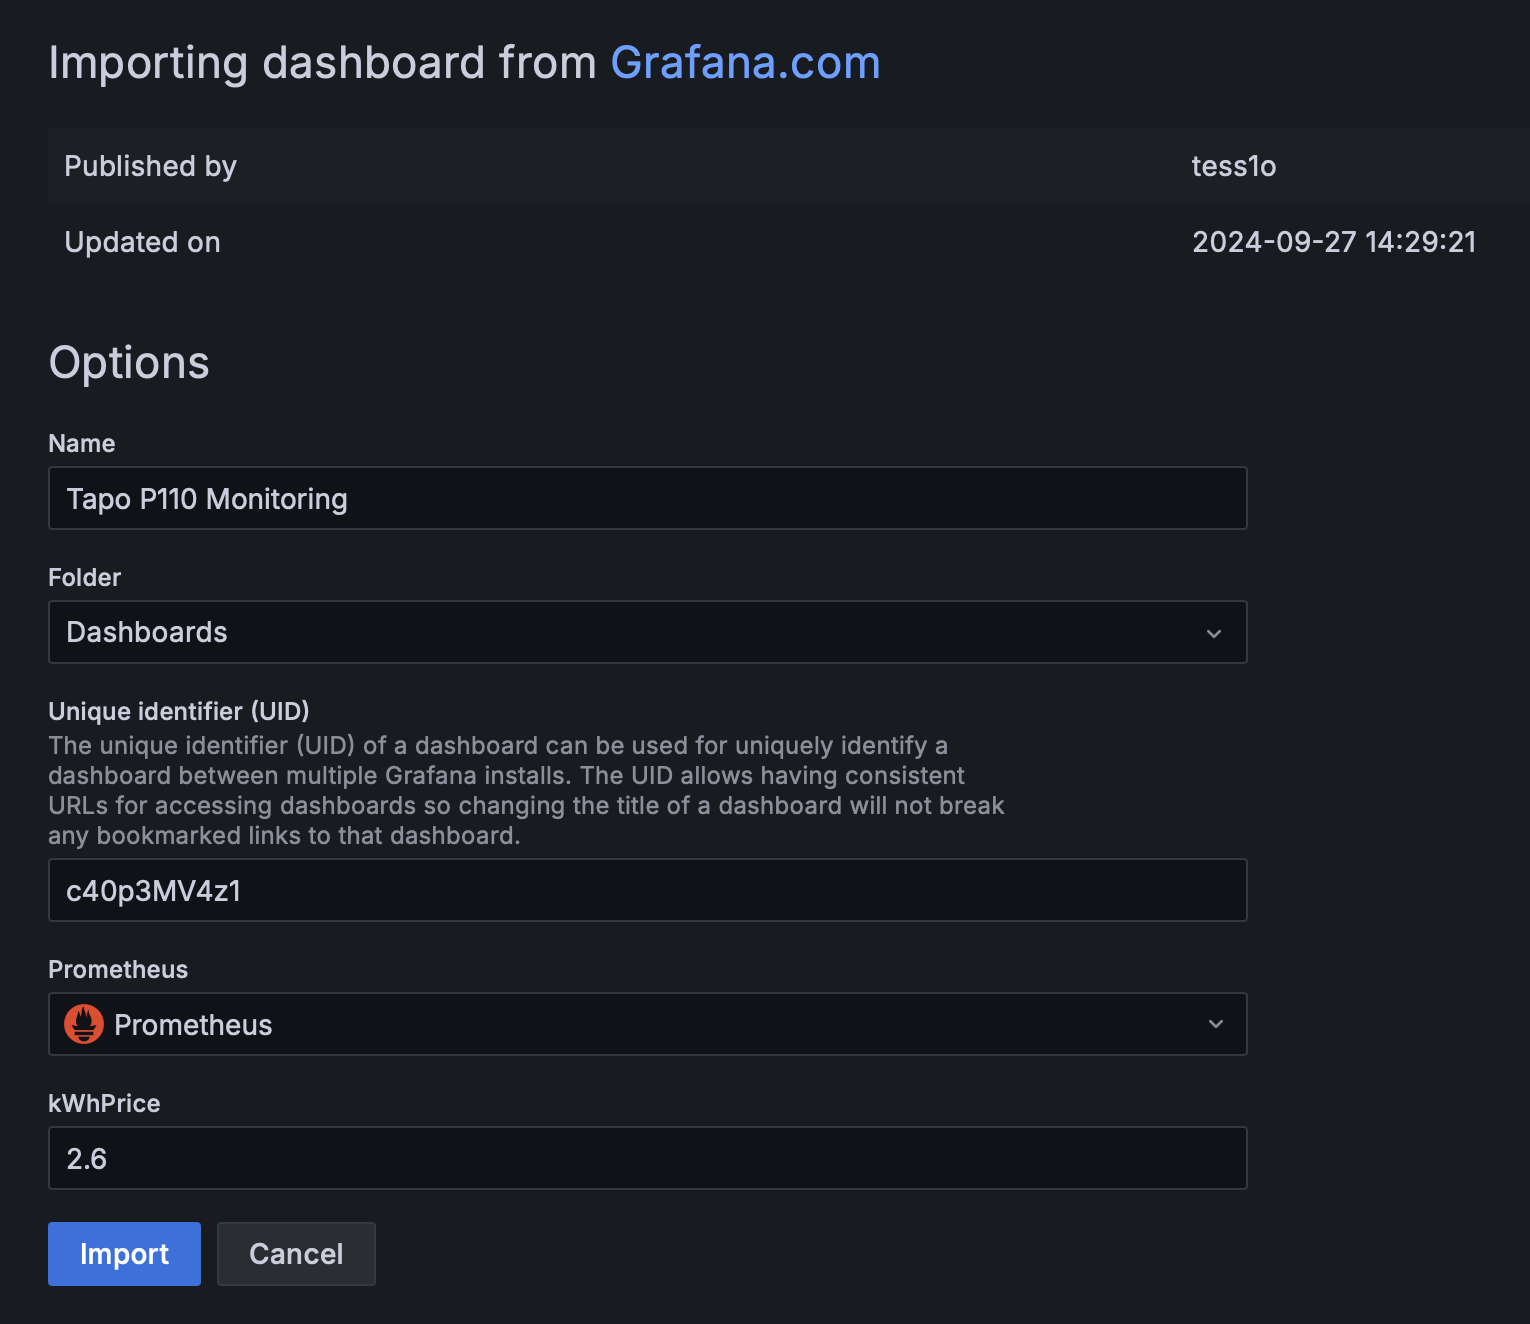
In Grafana import dashboard 21982 and selected the Prometheus datasource:
All existing solutions require the server to be located in the same network as P110 devices, since we send requests directly to them. There is a workaround how to run this setup on external server (some VPS for instance).
Here is an example how I did it using ASUS router.
- Configure static IP address for P110 device (in my example it's
192.168.50.50). You can select any local IP address, it doesn't matter - Configure port forwarding from external PORT (let's say
9876to192.168.50.50:80
- Configure DDNS in your ASUS router (I assume other routers supports similar feature) so we have a dedicated hostname
attached to our router. Can be skipped if you have static IP address from your provider. Let's say it's
example.asuscomm.com - Now in
config.json(see step #3 from installation instruction) you can use:
{
  "devices": [
    {
      "name": "Fridge",
      "ip_address": "example.asuscomm.com:9876"
    }
  ]
}
(pay attention I set port which we configured in step#2)
instead of
{
  "devices": [
    {
      "name": "Fridge",
      "ip_address": "192.168.50.50"
    }
  ]
}- Deploy everything on external VPS.

