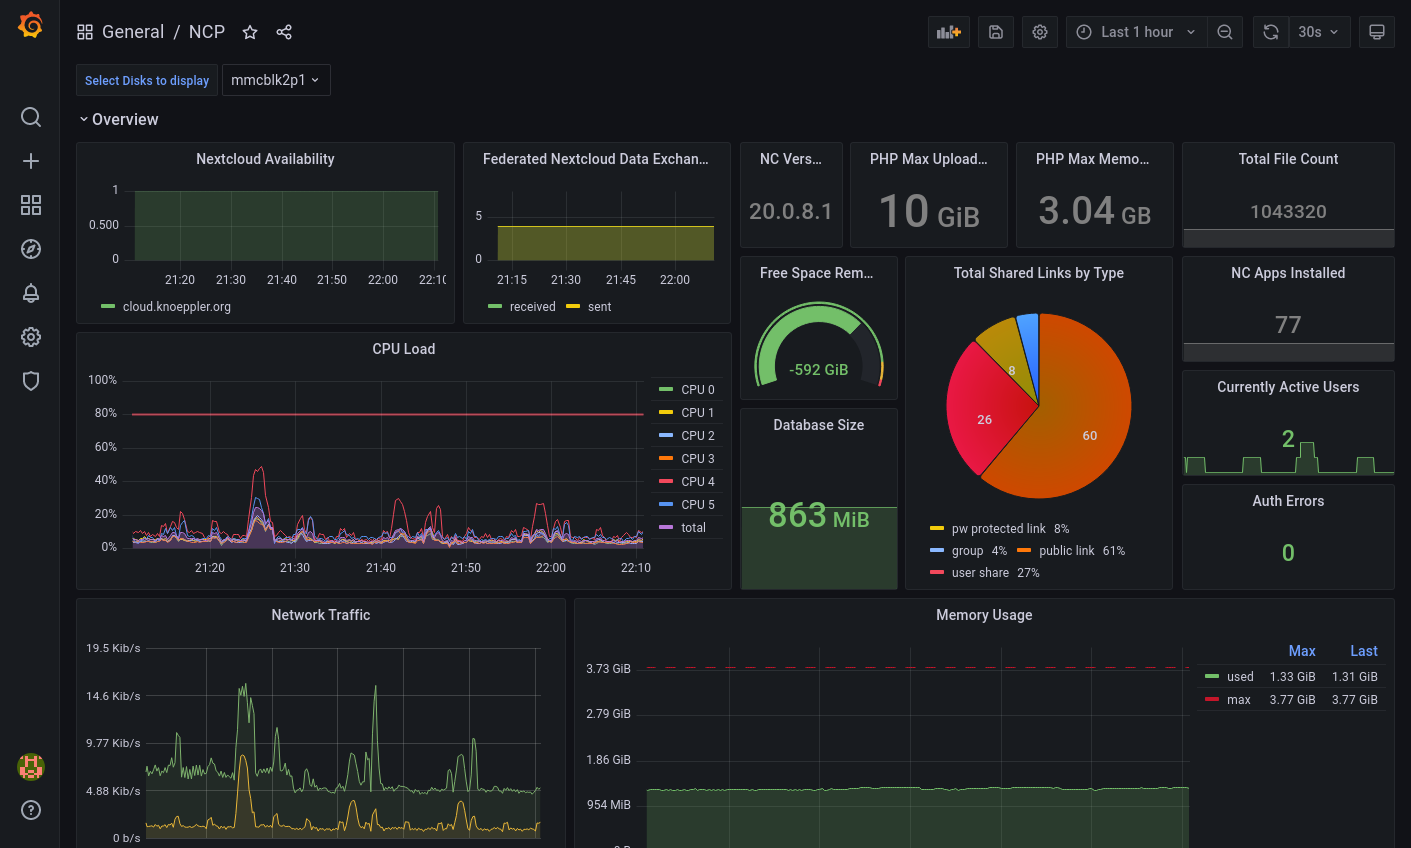
The quickest way to get a monitoring dashboard for nextcloudpi up and running
- Any current Linux OS (auto-installing docker-compose via the start script is only supported on Debian based systems (e.g. Ubuntu) )
- A ncp server that is reachable from the machine running the dashboard
-
Activate the metrics app in your ncp web panel or
ncp-config -
Create an authentication token for accessing the Nextcloud metrics
- SSH/Login to your ncp instance
- Generate an authentication token with the following code snippet:
TOKEN=$(openssl rand -hex 32)
ncc config:app:set serverinfo token --value "$TOKEN"
- Make sure to copy the generated token
-
Download and extract or clone this repository to your local computer
-
Configure the variables in .env
- The URL where your Nextcloud can be reached, goes in
NEXTCLOUD_SERVER - The authentication token (generated in 2.) goes in
NEXTCLOUD_AUTH_TOKEN - The username and password from the ncp metrics app (see 1.) go in
NCP_METRICS_USERNAMEandNCP_METRICS_PASSWORD
- The URL where your Nextcloud can be reached, goes in
-
Run the start script from a terminal with the command
./start.sh. You can optionally a address for your dashboard (which will be used for generating the SSL certificate) as a parameter, e.g../start.sh ownyourbits.com.
You should now be able to reach your grafana instance at http://localhost:8443 and login with:
user: admin
password: admin
!!! You must change this password if you intend to host the dashboard publicly !!!
After following the steps to setup the NCP monitoring dashboard, you can customize your configuration. Here are some ideas:
- Edit config/nginx/monitoring-dashboard.conf by uncommenting the lines starting with
# server_nameand replace<your domain here>with the domain at which your monitoring dashboard should be reachable. - Adjust the ports where you can reach the dashboard in
docker-compose.yml(service=>nginx=>ports) - Replace the self-signed certificates in config/nginx/cert with trusted certificates for your domain
- If you want to use your own reverse proxy, remove nginx from
docker-compose.ymland uncomment the port section of the grafana service
