Dec 20, 2021
This is the repo for Course Project of CS2309: Principles and Practice of Problem Solving, taught by Prof. Jieru Zhao and Prof. Haiming Jin, mainly finished with QT, C++, HTML, Javascript.
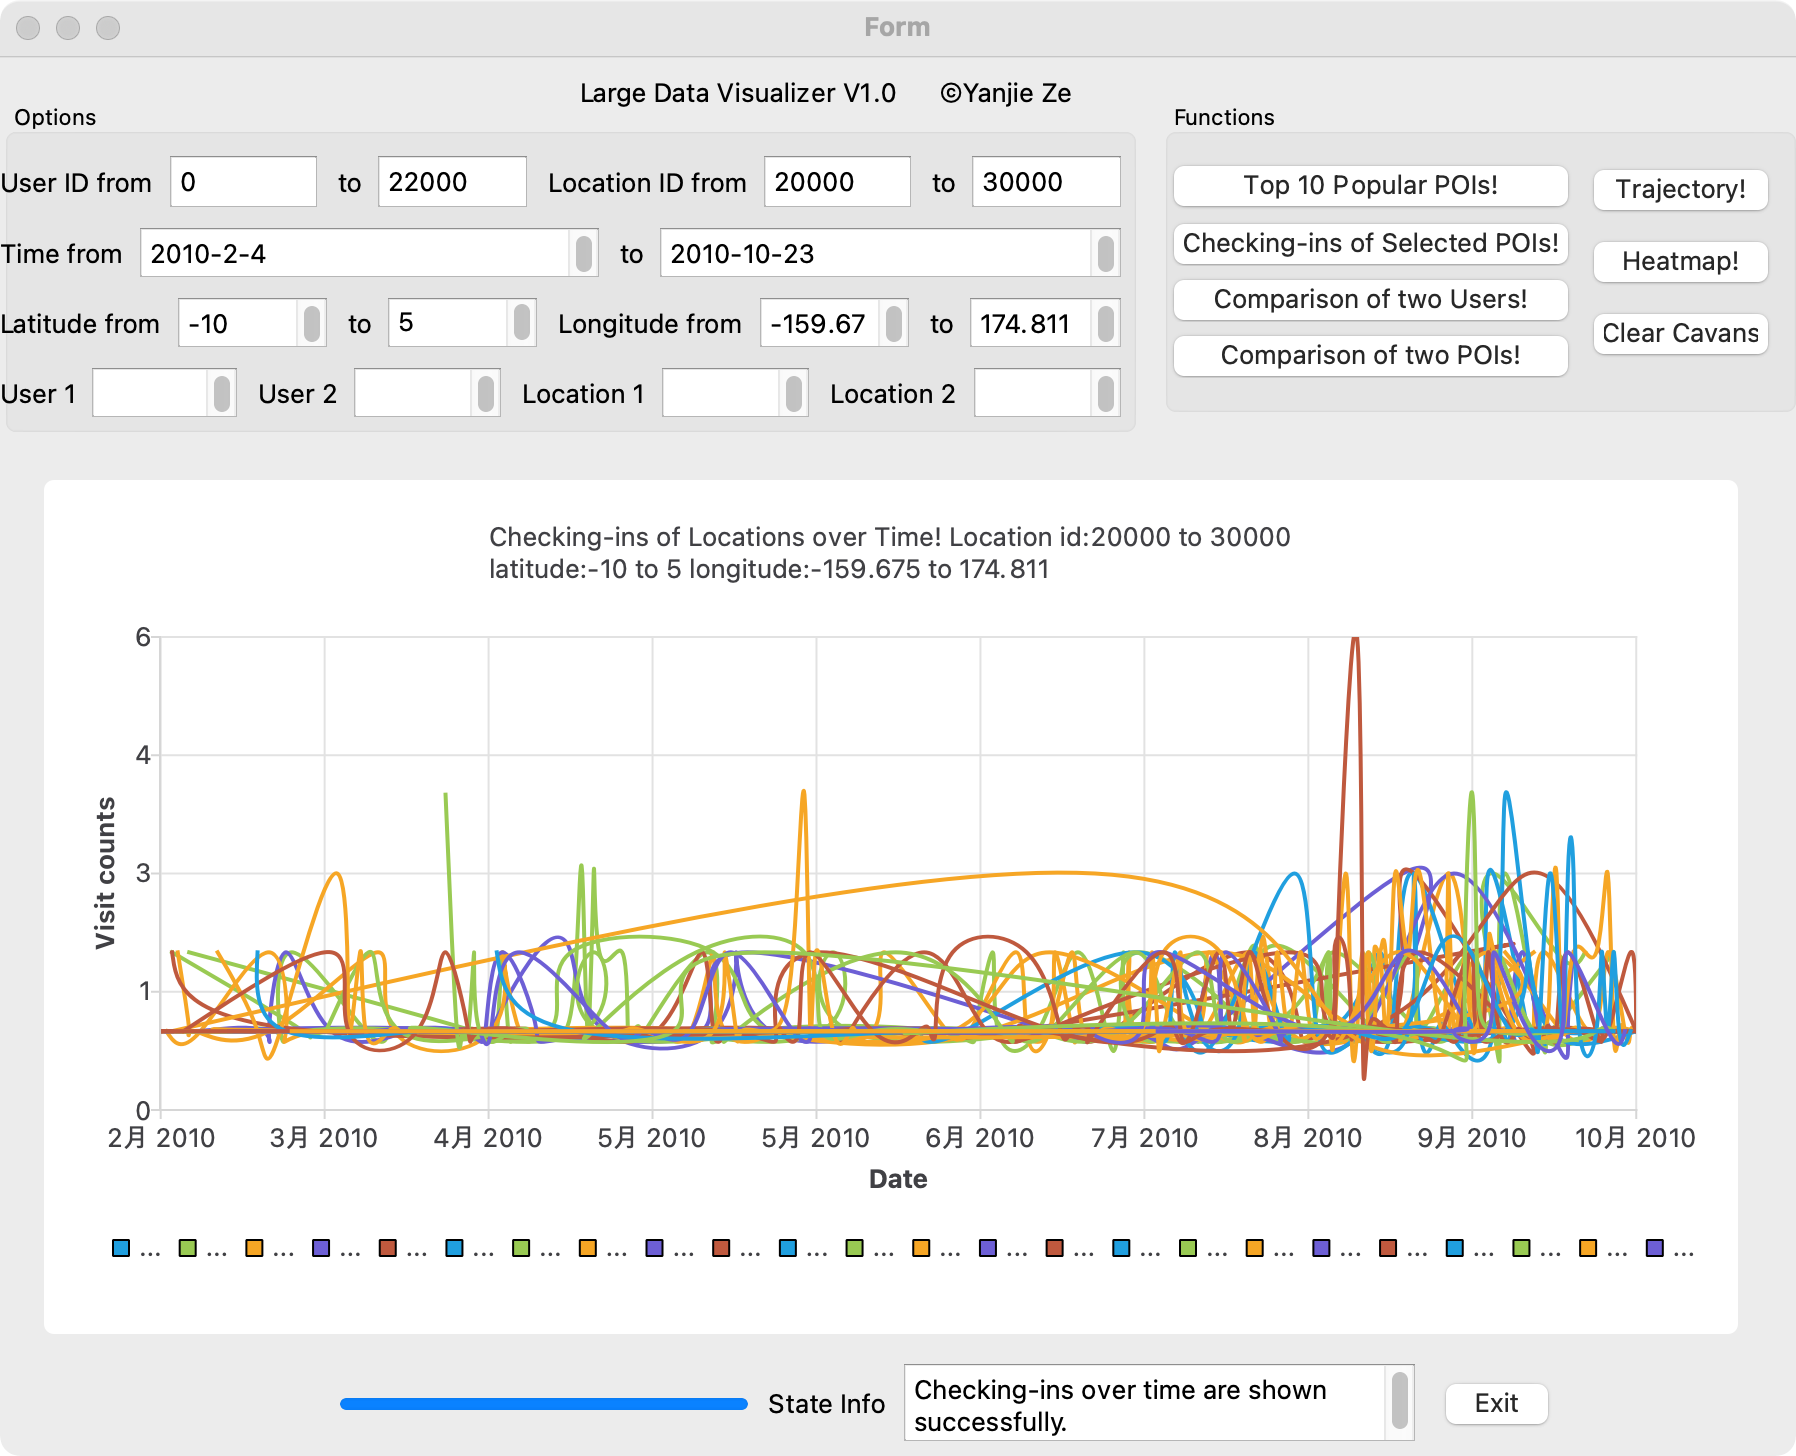
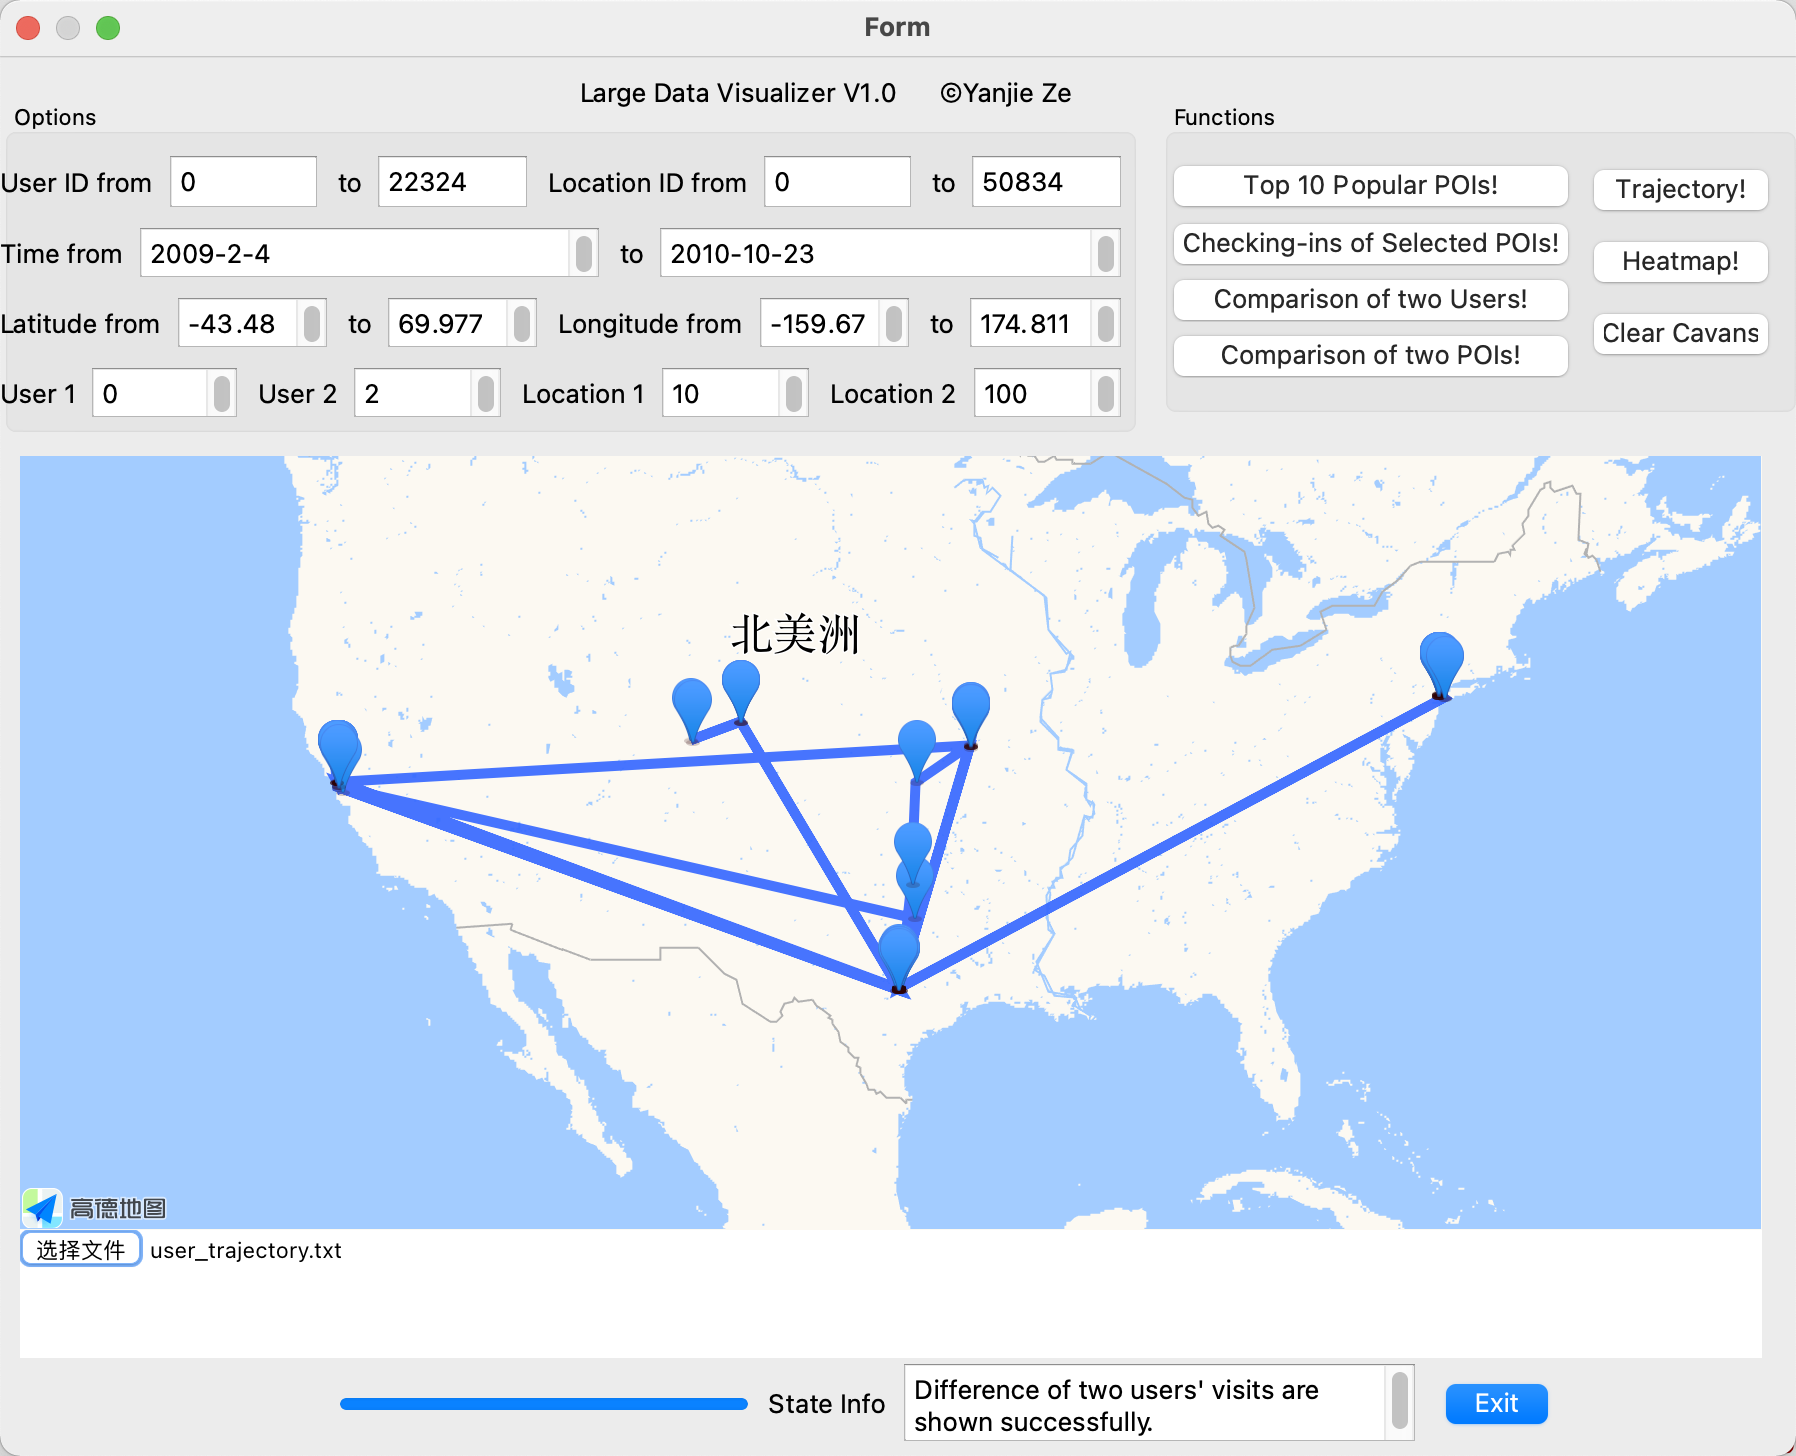
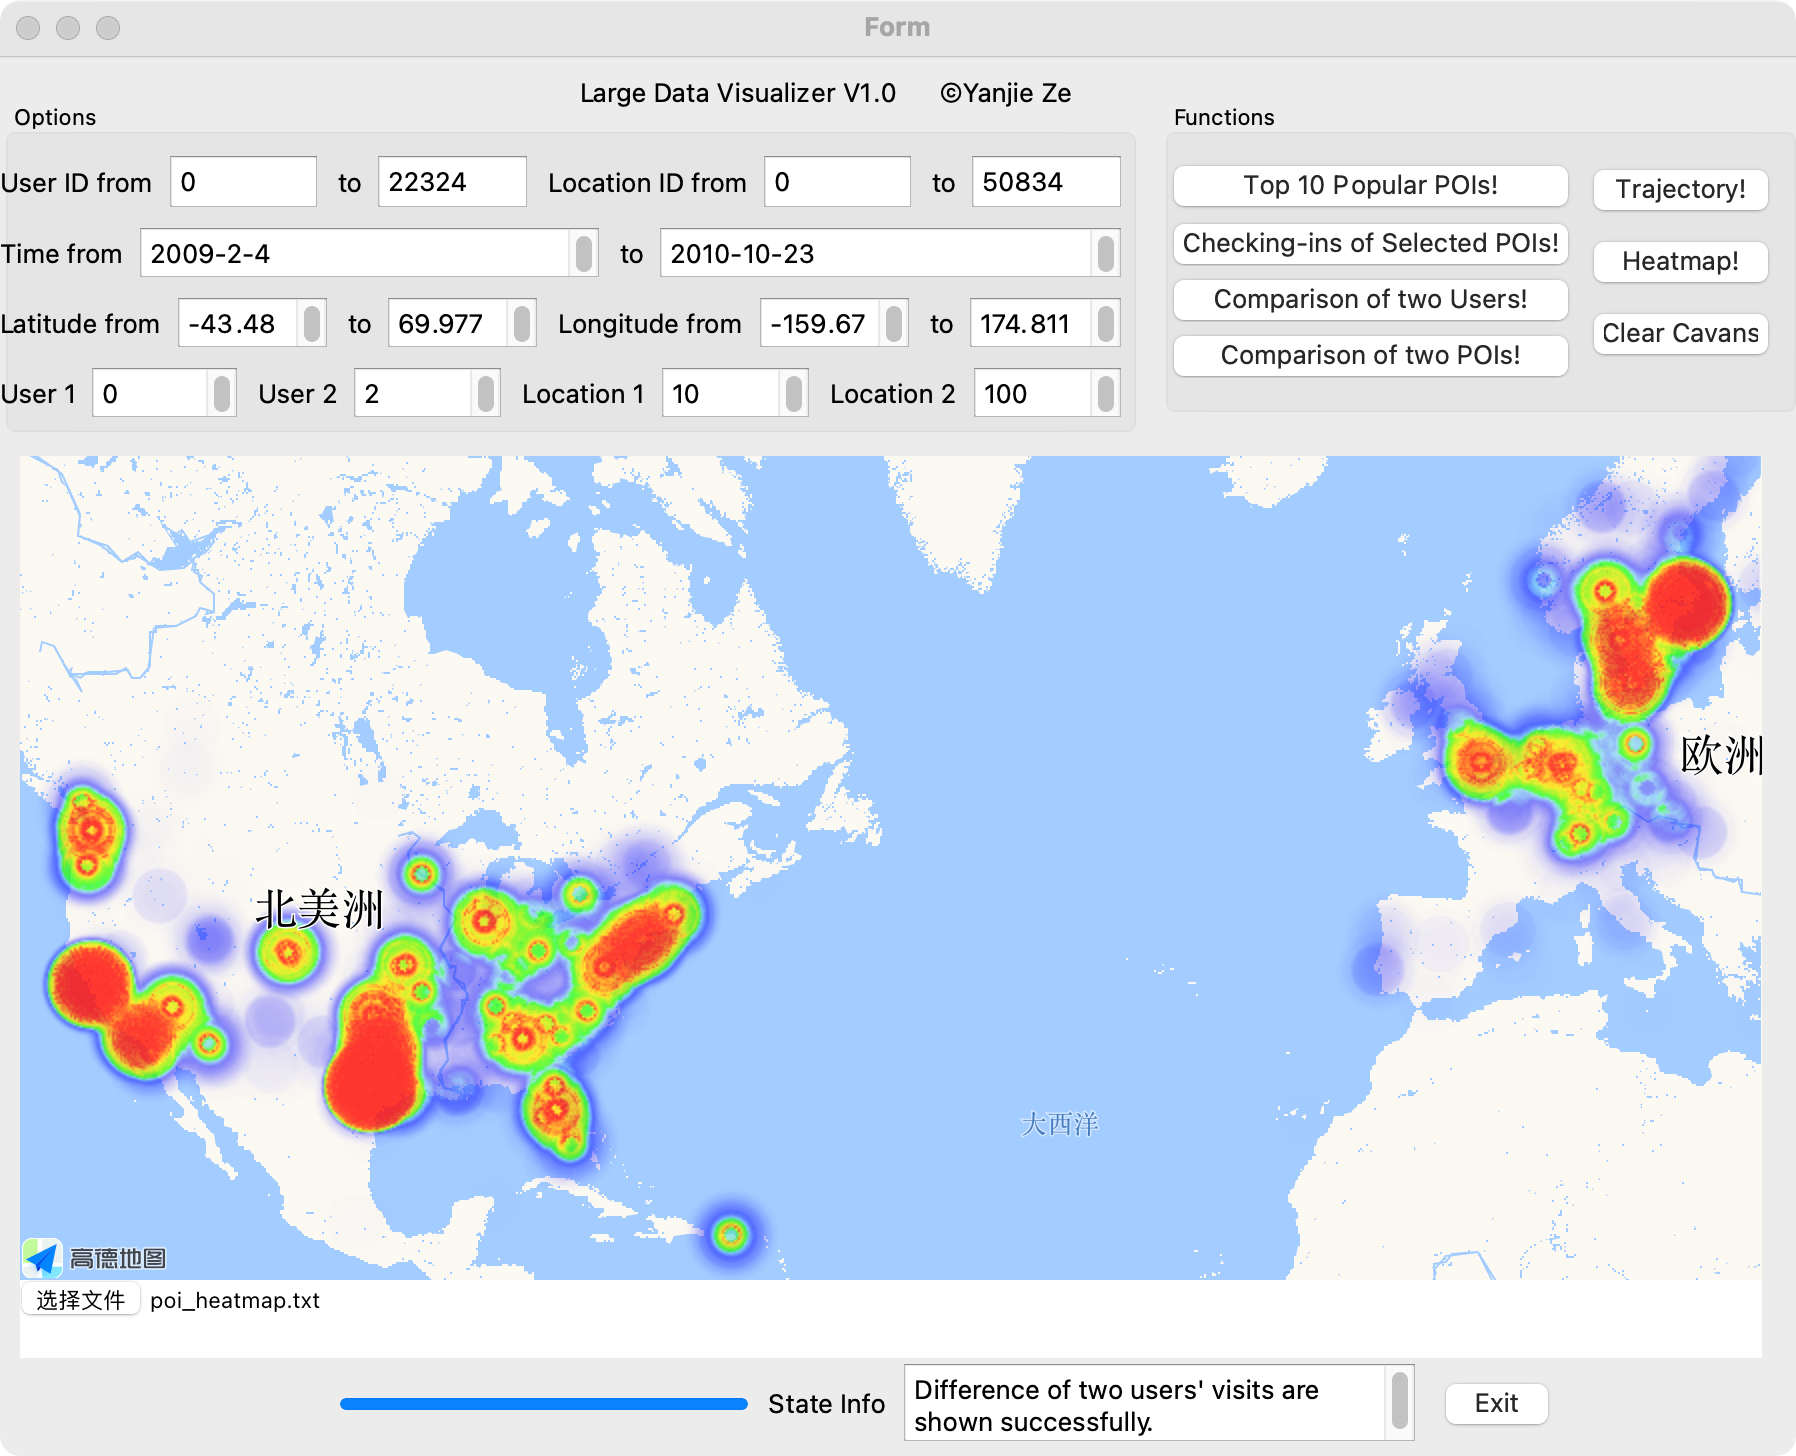
In this project, we analyze the POI data provided and visualize it. Some demos are shown below.
Fig 1. three functions implementedHere we will give instructions on how to run our project.
Preparation:
- Git clone this repo and open it with QT (5+).
- Download the data we use, provided in the release, named
gowalla.csv. - Complie and run our application.
Now you can see our GUI, and then:
- Click
Select Your Fileand select the downloaded file. - Click
read. - After the reading is finished, you can click several functions provided and try them!
We provide six functions:
- Top 10 Popular POIs! Display the top 10 popular POIs visited by a specific user (or a set of users) over time.
- Checking-ins of Selected POIs! Display the number of checking-ins of a specific POI (or POIs within a GPS range) over time.
- Comparison of two Users! Display the difference of visited POIs between two users over time.
- Comparison of two POIs! Display the daily active users (DAU) of two POIs.
- Trajectory! Display the trajectory of a specific user on the map.
- Heatmap! Display the heatmap of popular POIs, i.e., plot the thermal diagram in a period of time on the map.
Clear Canvas is used for clear the canvas.
If you get trouble using our code, please feel free to contact the author Yanjie Ze. Email: zeyanjie@sjtu.edu.cn


