Finding Lane Lines on the Road
The goals / steps of this project are the following:
- Make a pipeline that finds lane lines on the road
- Reflect on your work in a written report
1. Describe your pipeline. As part of the description, explain how you modified the draw_lines() function.
For this project I started off using the pipeline provided in the lesson. That seemed to work at first but severely broke down on the second video, with the yellow left lane line. I started making small improvements to the pipeline and this is what I ended up with:
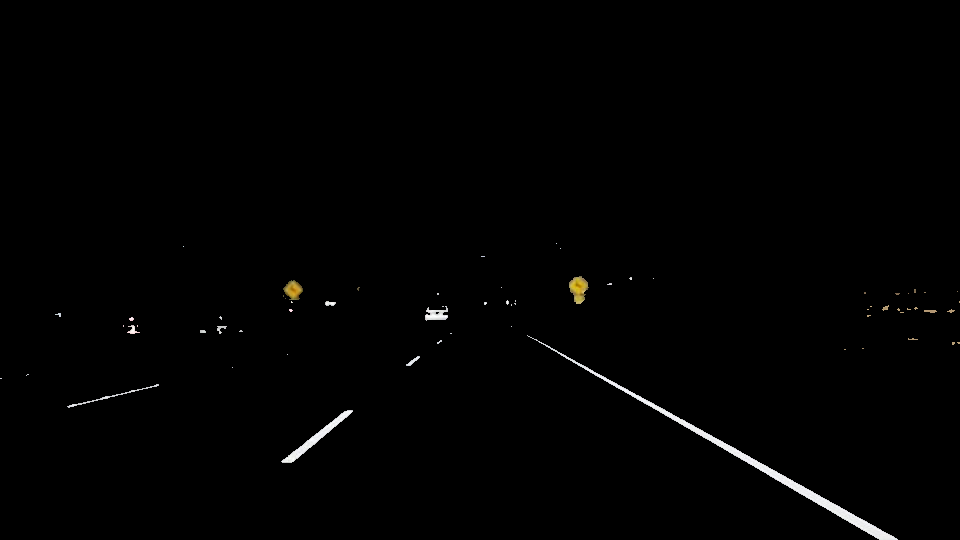
- First, I mask everything other than yellow and white colors, which leaves lane lines in the picture and excludes almost everything else. This provides a high-contrast environment that's better for edge detection

- I then apply greyscale but since this didn't provide good enough results, I did further Otsu thresholding in order to decrease the number of color values and increase contrast

- After edge detection, I created a region of interest mask. Again, I found better results by splitting the mask in two different trapezoid shapes, one for the left lane and one for the right lane.
- I ran Hough for the left lane and for the right lane separately and then did a weighted image average of the left side image and the right side image.
For draw_lines the initial steps were as follows:
- I first compute the slope of each line
- If the slope is negative, that means the points should belong on the left lane, so I append them to a list of left side points
- I use fitLine to extrapolate the lines to a single one for the left lane and a single one for the right lane
- I use the result to compute the slope and intercept for the left and right lines to be drawn
- I then draw the line using the same end points I used for the region of interest masking.
This approach did OK for the first 2 videos but performed very poorly on the challenge video
I realized that within a few sequential frames (let's say over 1 second, so around 30 frames), the lane line slope will not change that much. I created a list of the slopes for the past few frames and did an average over them. I then add the current slope to the average. If the slope deviates too much from the average, I don't add those points to the list of points that I fit a line to. If the slope is close enough to the average, I add the points and then do the fitLine. I then draw the line for the lane based on the average slope and intercept. This way, once the line has locked into position on top of the lane, it does change its slope based on new information but to a lesser extent, so the variation is dampened quite a bit.
This is what the final output looks like:

On a winding road with many turns, my approach would probably not change the average slope by enough, fast enough, to keeped being locked onto the lane line.
This approach also works well when the line segments detected within the lane lines are pretty sizable. On a section of the road where the lane line is covered by dirt or the paint has worn off, leaving smudges and very short segments, my approach would probably not detect a line at all.
One possible improvement would be to tweak the parameters related to the previous line history. Keeping track of more, or fewer past frames, changing how much the average can deviate, all these could potentially improve the result.