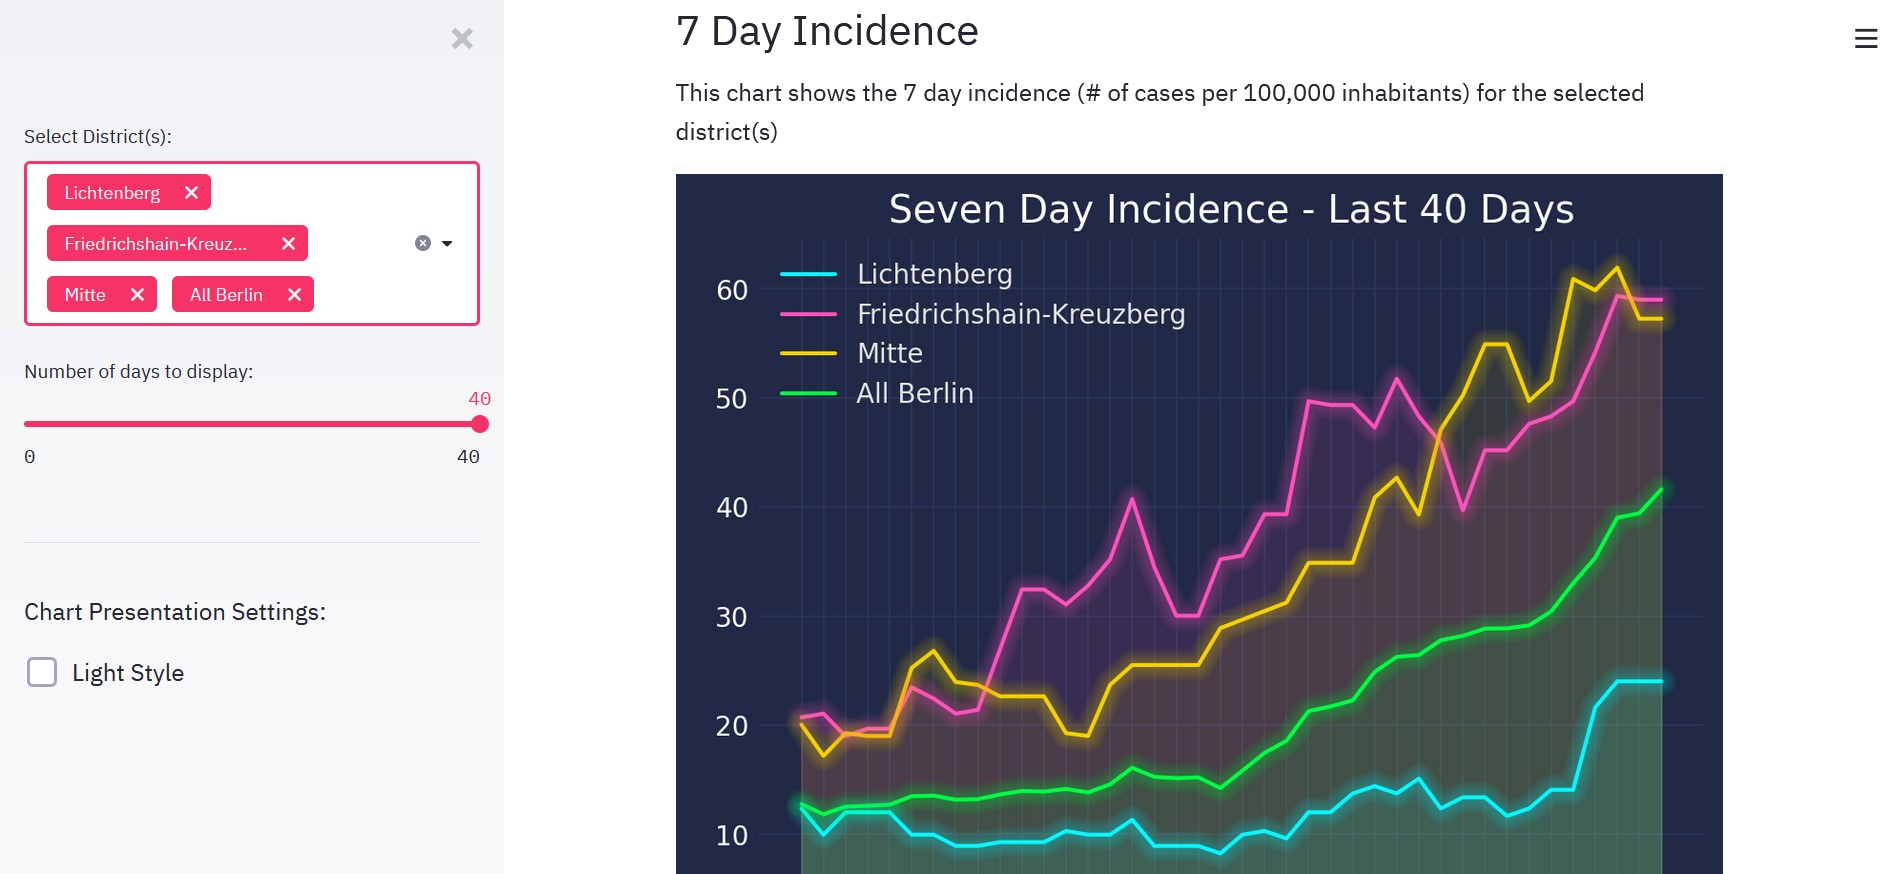
As we approach autumn and winter of 2020, and the number of Covid-19 cases begin to rise again across Europe, I wanted to find a way to keep track of my local situation. This is for my own interest and because some of the companies I work with are restricting who can enter the office based on the incidence of Covid-19 cases in their respective districts.
I became frustrated trying to get to the up-to-date figures for my area, so I decided to build a dashboard (around 6 months after all the cool kids started doing it) using Streamlit. I extract the data directly from the official figures posted on berlin.de, and then manipulate the data with pandas to make it show the information I want.
I have the default set to Lichtenberg (my home district) so that I just have to refresh the page to see the information I want, but I used Streamlit's selectbox function to allow the user to choose their own district, or a calculated 'All Berlin' field. The period can be adjusted using a slider.
I deployed the application using Heroku, the Procfile, setup.sh and requirements.txt are all included in this repository.
I was invited to participate in the Streamlit for Teams Beta, so I also deployed the latest version of the app there. This seems to be a little faster, as I am using the free tier on Heroku so it can take some time to 'spin up' the dynos which power the app if it hasn't been used for a while. The Streamlit for Teams solution doesn't seem to have this issue (for now).
The application is also online using Amazon Web Services EC2 at this link.
- Streamlit
- pandas
- Matplotlib
- MPL Cyberpunk
- Streamlit for Teams
- Docker
- Heroku
- AWS - Elastic Compute Cloud (EC2)
All feedback is warmly received. Craig Dickson can be contacted at craigdoesdata.de.

