CloudFormation template for a persistent, self-healing Graphite+Grafana stack.
Overview
This template bootstraps a Graphite stack with fixed public and private endpoints and pre-loaded with Elasticsearch and Grafana.
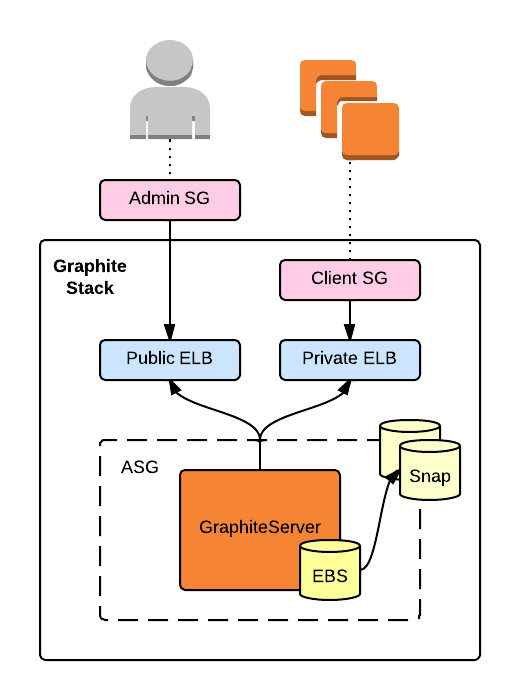
The public endpoint is accessible via the injected admin security group. The private endpoint is accessible by servers associated with the generated client security group.
The stack runs a single server within an auto-scaling group. Metric and dashboard data is stored in an attached EBS volume that the server snapshots hourly (and trims all but the newest five).
If the server is terminated, the auto-scaling group will launch a replacement with an EBS volume created from the latest snapshot. The replacement server will automatically register with both ELBs.
The template creates a security group for Graphite clients, the id for which is exposed as an output (ClientSecurityGroup).
Note that this template must be used with Amazon VPC. New AWS accounts automatically use VPC, but if you have an old account and are still using EC2-Classic, you'll need to modify this template or make the switch.
Usage
1. Clone the repository
git clone git@github.com:thefactory/cloudformation-graphite.git2. Create an Admin security group
This is a VPC security group containing access rules for Graphite administration and dashboards, and should be locked down to your IP range, a bastion host, or similar. This security group will be associated with the Graphite server and ELBs.
Inbound rules are at your discretion, but you may want to include access to:
22 [tcp]- SSH port2003 [tcp]- Graphite TCP port80 [tcp]- Graphite HTTP port
3. Create an initial EBS snapshot
(Sorry, this isn't very elegant. Pull request?)
- Create an EBS volume of whatever size you want your Graphite metrics volume to be
- Attach the volume to an existing instance
- Format the volume as ext4 (
mkfs.ext4 <device>) - Snapshot the volume. You will pass this snapshot ID as
GraphiteEbsSnapshot - Detach and delete the volume
4. Launch the stack
Launch the stack via the AWS console, a script, or aws-cli.
See graphite.json for the full list of parameters, descriptions, and default values.
Example using aws-cli:
aws cloudformation create-stack \
    --template-body file://graphite.json \
    --stack-name <stack> \
    --capabilities CAPABILITY_IAM \
    --parameters \
        ParameterKey=KeyName,ParameterValue=<key> \
        ParameterKey=GraphiteEmail,ParameterValue=<email> \
        ParameterKey=GraphiteEbsSnapshot,ParameterValue=<snapshot_id> \
        ParameterKey=VpcId,ParameterValue=<vpc_id> \
        ParameterKey=Subnets,ParameterValue='<subnet_id_1>\,<subnet_id_2>' \
        ParameterKey=AdminSecurityGroup,ParameterValue=<sg_id>
5. Test Graphite and Grafana
Once the stack has been provisioned, try hitting the Graphite web UI at http://<public_endpoint>/. You will need to do this from a location granted access by the specified AdminSecurityGroup.
Next, associate ClientSecurityGroup with one of your instances and (from that instance) try sending some data to the private endpoint:
$ echo "mytest $RANDOM `date +%s`"|nc <private_endpoint> 2003If you refresh the web UI, you should see the mytest series under the Graphite folder.
Finally, try loading Grafana at http://<public_endpoint>/grafana. You should see the default dashboard with a chart of randomly-generated Graphite data.