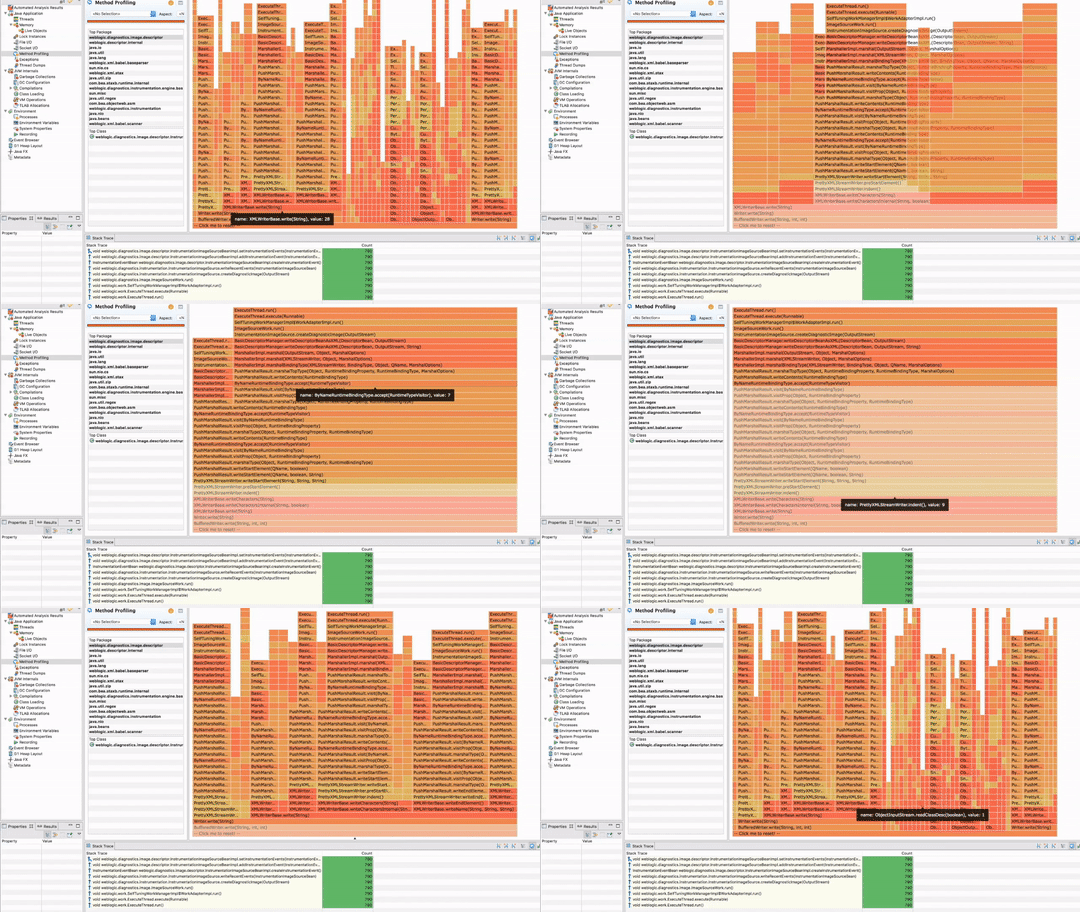
Community collaboration to provide a view that renders stacktrace selections as flame graphs in Mission Control.
For the latest version, check the JDK Mission Control repo at https://github.com/openjdk/jmc.
This plug-in should provide a good example for how to use JavaScript visualization technologies to render complex information from java flight recordings in JDK Mission Control.
To start working on the flame-view, and to test the flame-view:
- First import the JMC project into Eclipse.
- Don't forget to import the launchers.
- Copy and rename one of the launchers (for example the JMC RCP plug-ins launcher), to have your own launcher configuration.
- Import the two eclipse projects (the plug-in and the feature projects) from this repo into your eclipse.
- Add org.openjdk.jmc.feature.flightrecorder.ext.flamegraph to the features to launch in your launcher.
- Launch JMC from within Eclipse with your new launcher.
To use the view in JMC:
- Go to Window | Show View | Other...
- Select Mission Control / Flame View
- Put the view where you want it, and select something in the UI that normally has a stack trace aggregate, for example something from the Memory page, or something from the Method Profiling page
For more detailed instructions on how to get going, see http://hirt.se/blog/?p=989.
