Frontend Mentor - Expenses chart component solution by Kashan - Accessible and Animated
Users should be able to:
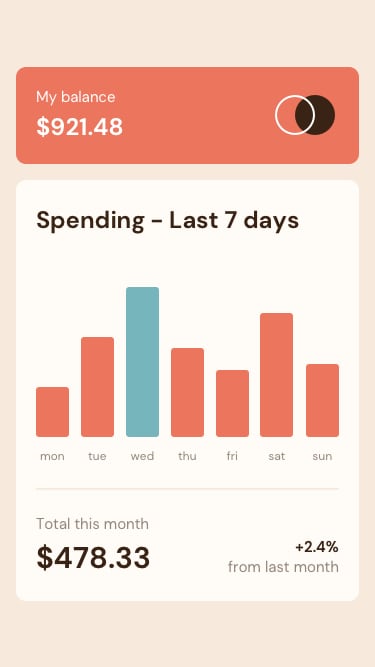
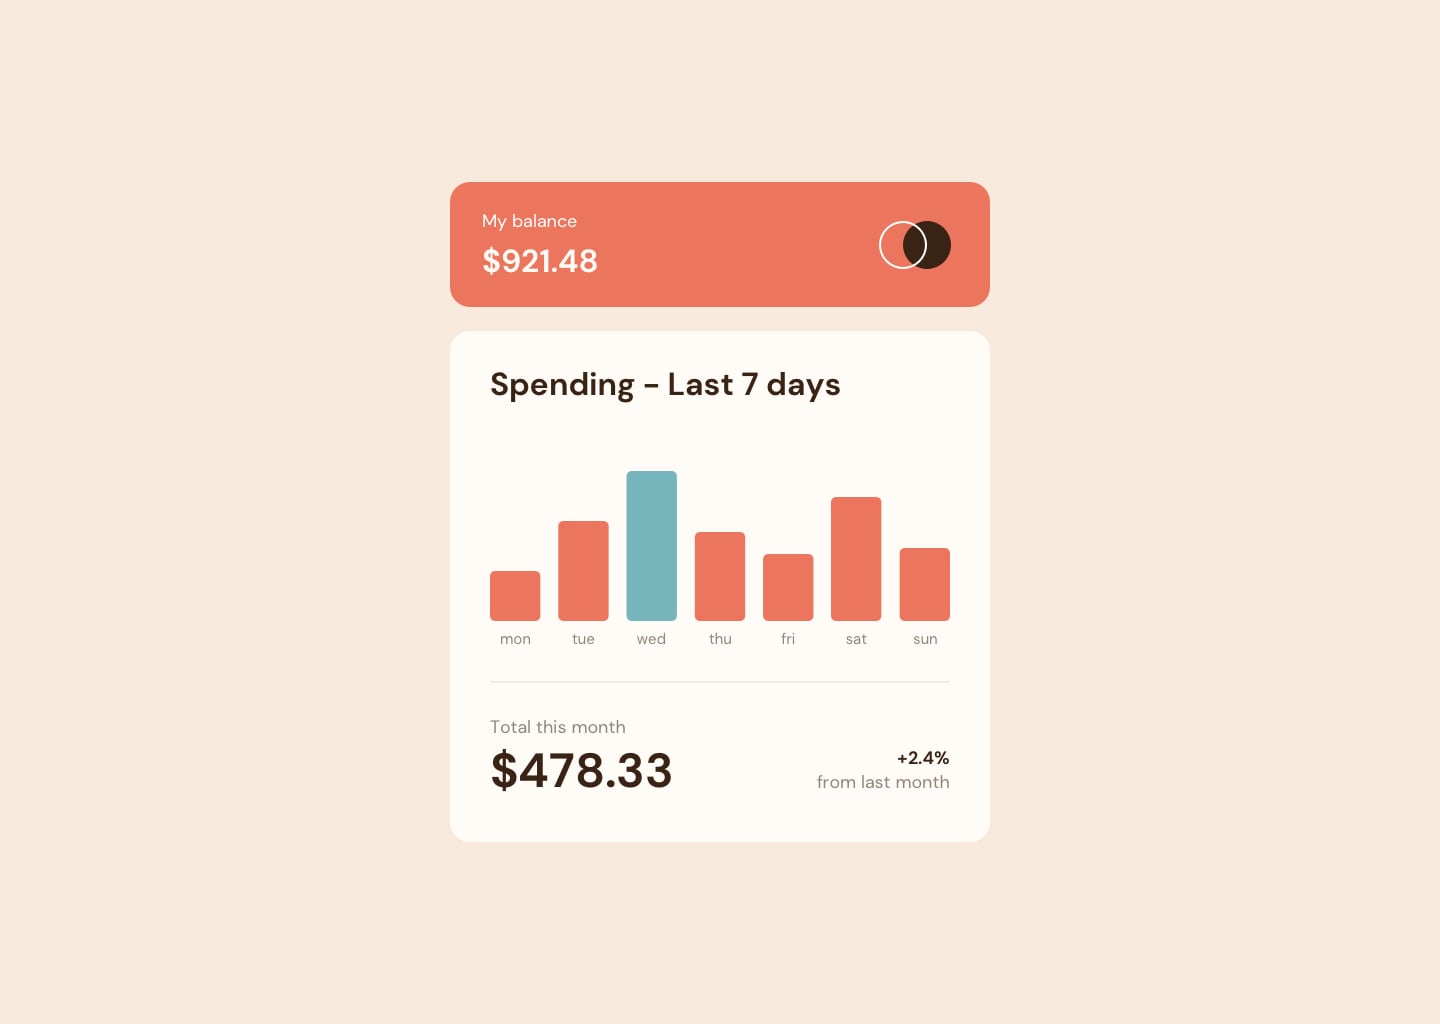
- View the bar chart and hover over the individual bars to see the correct amounts for each day
- See the current day’s bar highlighted in a different colour to the other bars
- View the optimal layout for the content depending on their device’s screen size
- See hover states for all interactive elements on the page
- Bonus: Use the JSON data file provided to dynamically size the bars on the chart
- React + Tailwind (No chart library used)
- Live site: Click here ↗
- Source code: Click here ↗
- Semantic HTML5 markup
- Flexbox (Loads of it)
- Mobile-first workflow
- CSS Grid (place-items: center; rocks)
- React (For the chart and chart loader)
- Tailwind - Styled the whole thing within 20 minutes
- Gsap - For the animations, cuz they look good ✨
- You do not need a chart library to make a chart (for a chart this simple).
- You can use
useEffectto animate the chart on load. - You can maintain a11y by using
aria-hiddenand CSS pseudo elements. - React is great for JS-based animations since your app is already in JS.
Here's the markup for the chart itself, really accessible and easy to understand:
<div
  aria-label="Transactions List"
  className="flex items-end w-full max-w-full gap-3"
>
  {transactions.map((transaction, i) => (
    <TransactionComponent
      key={i}
      {...transaction}
      percentage={percentages[i]}
    />
  ))}
</div>
and here's the markup for the bars. The bars themselves are buttons (read-only) since they have tooltips and hover doesn't work on mobile.
<button
  aria-readonly="true"
  aria-label="Transacted Amount Per Day"
  className="transaction relative inline-flex flex-col gap-2 items-center justify-end w-full mt-6"
>
  {/* Amount */}
  {/* The reason why this is screenreader-only is cuz the one we see on
  screen is an ::after pseudo element, not that accessible that guy. */}
  <span aria-label="Amount" className="sr-only">
    ${amount}
  </span>
  {/* Bar */}
  {/* Really tried not using an actual element for the bar but can't help.
  aria-hidden solves the screenreader issue, .bar::before is the bar itself. */}
  <span
    aria-hidden="true"
    data-amount={`$${amount}`}
    className={`bar relative w-full h-36 md:h-28 flex flex-col justify-end ${
      percentage == 100 ? "bar-largest" : ""
    }`}
    style={{
      // Initially, the height is 5% so it animates later in.
      // eslint-disable-next-line @typescript-eslint/ban-ts-comment
      // @ts-ignore
      "--height": `5%`,
    }}
  ></span>
  {/* Day */}
  <span aria-label="Day" className="w-full text-gray-500 text-[.65rem]">
    {day}
  </span>
</button>
Lemme show you how the bar is styled:
/* Transaction Bar */
.bar::before {
  content: "";
  @apply bg-primary rounded-sm md:rounded-md inline-block w-full h-[var(--height)] transition-all duration-500;
}

.transaction:is(:hover, :focus) .bar::before {
  @apply opacity-60;
}

.bar.bar-largest::before {
  @apply bg-secondary;
}
Super simple and easy to understand. I love Tailwind. 💙 Also, the reason why I'm using the @apply directive is because you write wayyy less CSS plus you always stay in touch with your theme.
One more thing, the loader. There's a simple skeleton loader for the chart and it's made with Tailwind's animate-pulse class. The animation is done with Gsap.
export function TransactionSkeletonComponent({ bars }: { bars: number }) {
  return (
    <>
      <div role="alert" className="sr-only">
        Loading Transactions...
      </div>
      <div aria-hidden="true" className="h-44 md:h-40 flex gap-3 items-end">
        {Array.from({ length: bars }).map((_, i) => (
          <div
            key={i}
            style={{
              height: `${Math.floor(Math.random() * 100)}%`,
            }}
            className="w-1/4 bg-gray-300 rounded-md animate-pulse"
          ></div>
        ))}
      </div>
    </>
  );
}
Notice the alert role, it's important to let the user know that the chart is loading. Also, the aria-hidden attribute is important to hide the skeleton from screenreaders.
Now, lemme show you the little maths I did to calculate percentages based on the fetched transactions. Transactions is already a state so percentages directly get calculated upon each render:
const [transactions, setTransactions] = useState<Transaction[]>([]);

/**
 * The percentage of each transaction based on the largest.
 */
const percentages = useMemo(() => {
  // Get the amounts from the transactions.
  const amounts = transactions.map((transaction) => transaction.amount);

  // Get the max amount.
  const max = Math.max(...amounts);

  // Using the max amount as the base, get the percentage of each amount.
  // This will be used to set the height of each transaction.
  return amounts.map((amount) => (amount / max) * 100);
}, [transactions]);
Since I'm fetching the transactions from a local JSON file, there was no need to use Zod or any other validation library, a simple fetch was enough:
/**
 * Fetch transactions effect.
 */
useEffect(() => {
  // A 3-second delay just to have a nice loading animation.
  setTimeout(() => {
    (async function () {
      setTransactions(
        await fetch("/transactions.json").then((res) => res.json())
      );
    })();
  }, 3000);
}, []);
And as soon as percentages are calculated, I animate the bars in, since by now the bars are already on the screen:
/**
 * Bars animation effect.
 */
useEffect(() => {
  if (percentages.length == 0) return;

  const tl = gsap.timeline();

  animateBars(tl, percentages);

  return () => {
    tl.kill()
  }
}, [percentages]);
Now, lemme show you these animate functions, really simple GSAP stuff.
export function animate(tl: gsap.core.Timeline) {
  // Animate everything in
  tl.fromTo(
    [
      "article > *",
      "h1",
      "svg",
      "h2",
      "h3",
      "h4",
      "h5",
      "h6",
      "div",
      "p",
      "button",
    ],
    {
      y: 20,
      opacity: 0,
    },
    {
      y: 0,
      opacity: 1,
      stagger: 0.1,
      duration: 0.5,
    }
  );
And also the bars:
export function animateBars(tl: gsap.core.Timeline, percentages: number[]) {
  percentages.forEach((percentage, i) => {
    tl.fromTo(
      `.transaction:nth-child(${i + 1}) .bar`,
      {
        "--height": "5%",
      },
      {
        // .bar::before uses this height property
        "--height": `${percentage}%`,
        duration: 0.25,
        ease: "power1.out",
      },
      "<"
    );
  });
}
This whole thing without the animations took me about 40 minutes and adding the animations took me 20, writing this markdown took me an hour so documentation > coding 😂
I'd be working on this project with other technologies and libraries. Will be using it as a learning point for other libraries and frameworks.
- ChatGPT - I mean c'mon man.
- Twitter - @oikashan
- Website - oikashan.com
- Frontend Mentor - @oikashan
You read this far? You're awesome. Here's a moon for you 🌚 Btw, know someone who's looking for a Web and/or App Developer and/or Designer? Send 'em my way 🚀

