-
Kafka (Confluent)
-
Zookeeper
-
Kafka Schema Registry (Confluent)
-
KSQLDB
-
Kafka Connect
-
Prometheus
-
Grafana
-
AKHQ (https://akhq.io/)
-
ZooNavigator (https://zoonavigator.elkozmon.com/en/stable/)
1. Clone the Kafka Monitoring Suite repository.
$ git clone https://github.com/streamthoughts/kafka-monitoring-stack-docker-compose.git
$ cd kafka-monitoring-stack-docker-compose
2. Start Confluent/Kafka cluster.
Deploy one of the provided docker-compose stack:
Note: Depending on your network speed, this may take few minutes to download all images.
Start/Stop with:
$ ./single-node-stack-start.sh
$ ./single-node-stack-stop.sh

# or directly
$ docker-compose -f  zk-kafka-single-node-stack.yml up -d
$ docker-compose -f zk-kafka-single-node-stack.yml down$ docker-compose -f zk-kafka-multiple-nodes-stack.yml up -d
$ docker-compose -f zk-kafka-multiple-nodes-stack.yml down$ ./sasl-single-node-stack-start.sh
$ ./sasl-single-node-stack-stop.sh$ docker-compose -f zk-kafka-multiple-nodes-secured-stack.yml up -d
$ docker-compose -f zk-kafka-multiple-nodes-secured-stack.yml downStart/Stop with:
$ ./full-single-node-stack-start.sh
$ ./full-single-node-stack-stop.sh

# or directly
$ docker-compose -f  zk-kafka-single-node-full-stack.yml up -d
$ docker-compose -f  zk-kafka-single-node-full-stack.yml down
3. Create Topic.
Create demo-topic with 6 partitions and 3 replicas.
$ docker exec -it kafka101 \
kafka-topics \
--create \
--partitions 6 \
--replication-factor 3 \
--topic demo-topic \
--bootstrap-server kafka101:29092
4. Produce messages.
Open a new terminal window, generate some message to simulate producer load.
$ docker exec -it kafka101 \
kafka-producer-perf-test \
--throughput 500 \
--num-records 100000000 \
--topic demo-topic \
--record-size 100 \
--producer-props bootstrap.servers=kafka101:29092
5. Consume messages.
Open a new terminal window, generate some message to simulate consumer load.
$ docker exec -it kafka101 \
kafka-consumer-perf-test \
--messages 100000000 \
--timeout 1000000 \
--topic demo-topic \
--reporting-interval 1000 \
--show-detailed-stats \
--bootstrap-server kafka101:29092
6. Open Grafana.
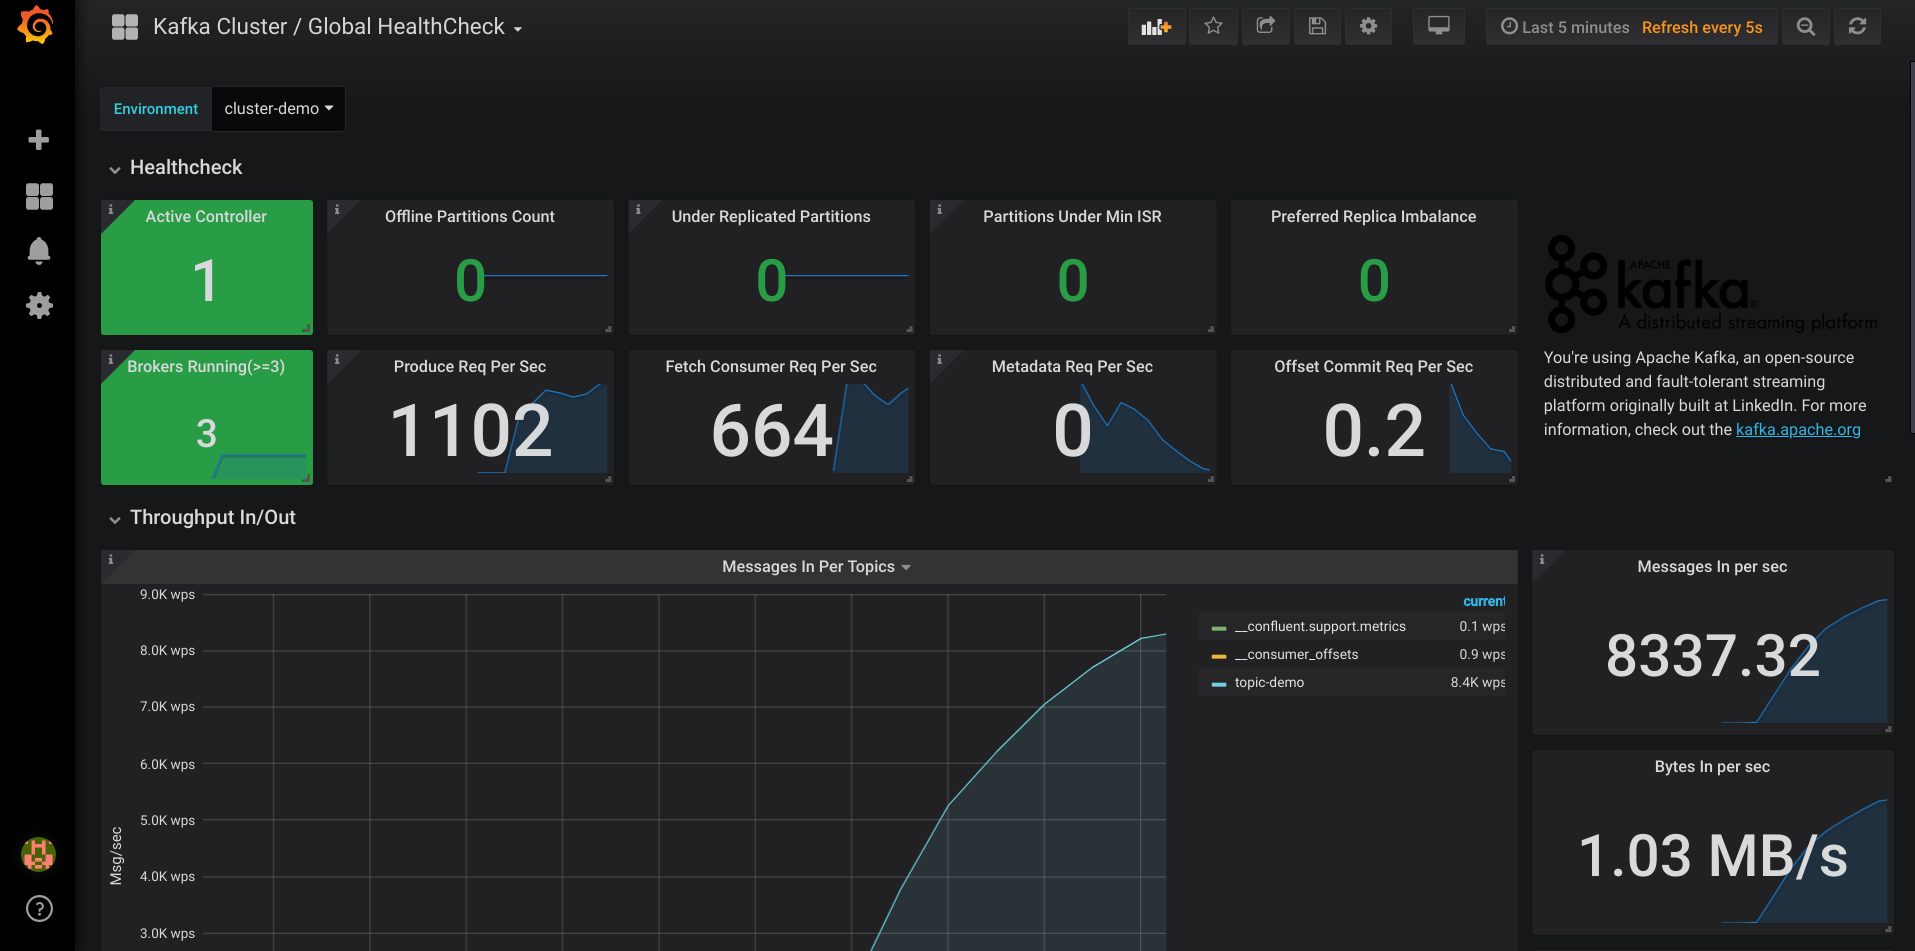
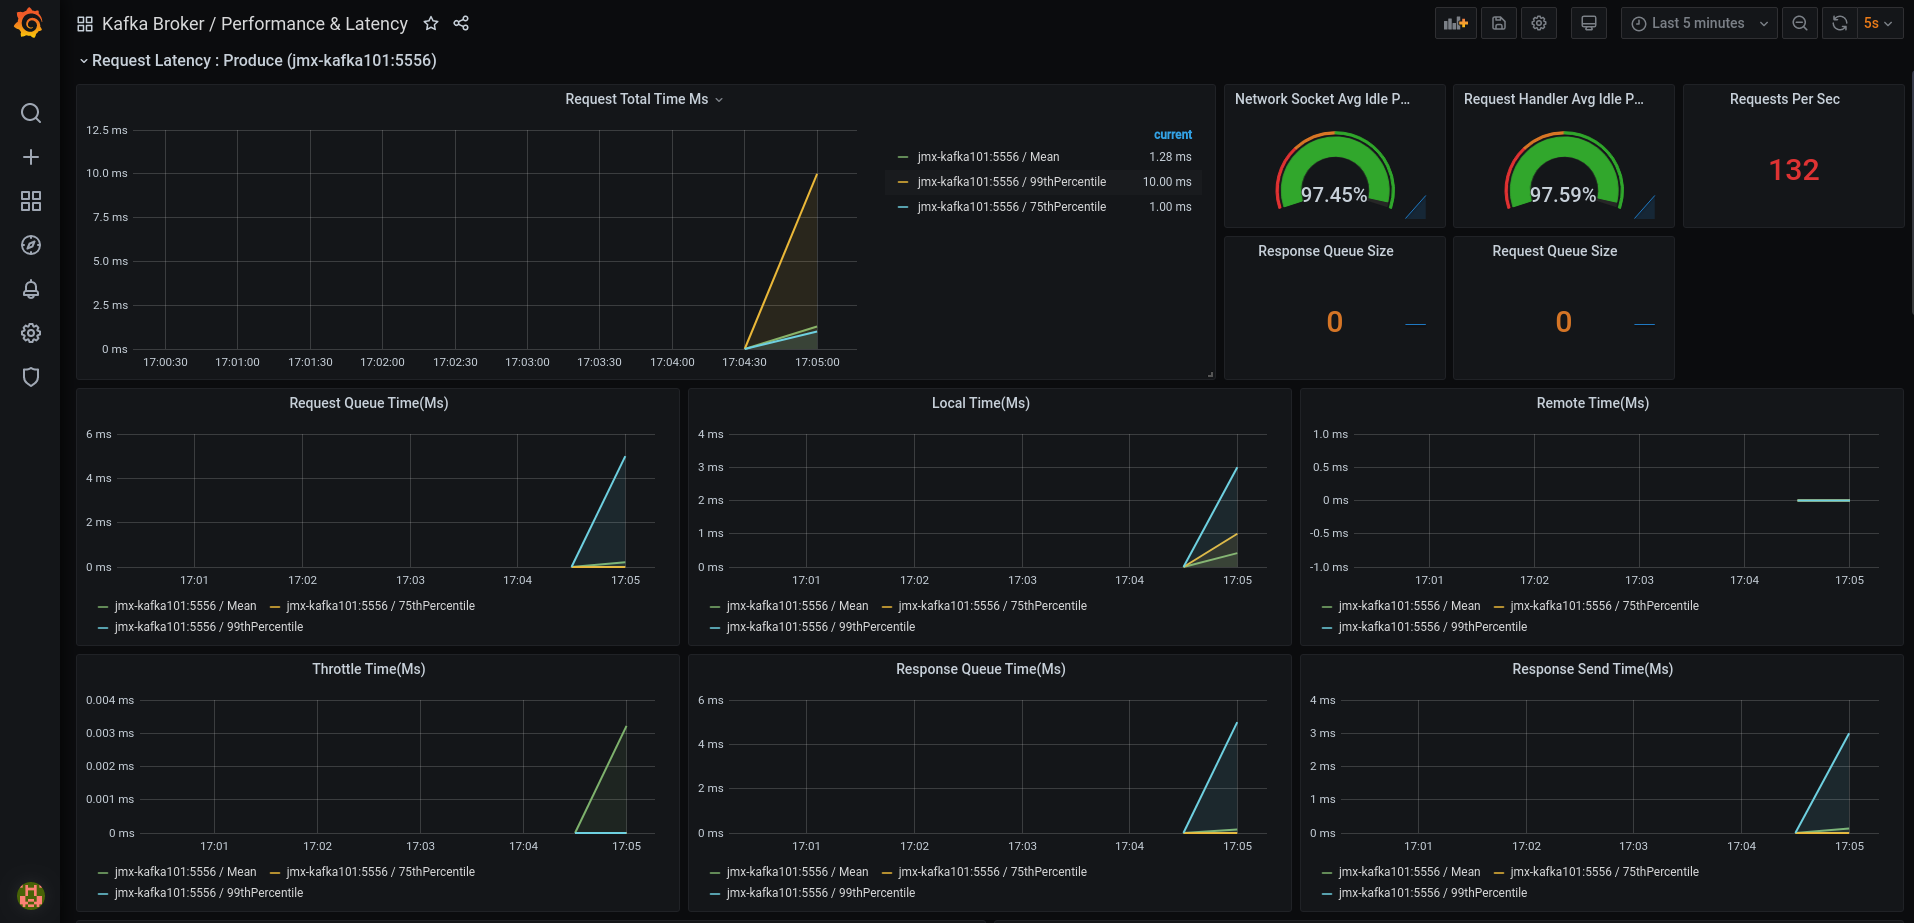
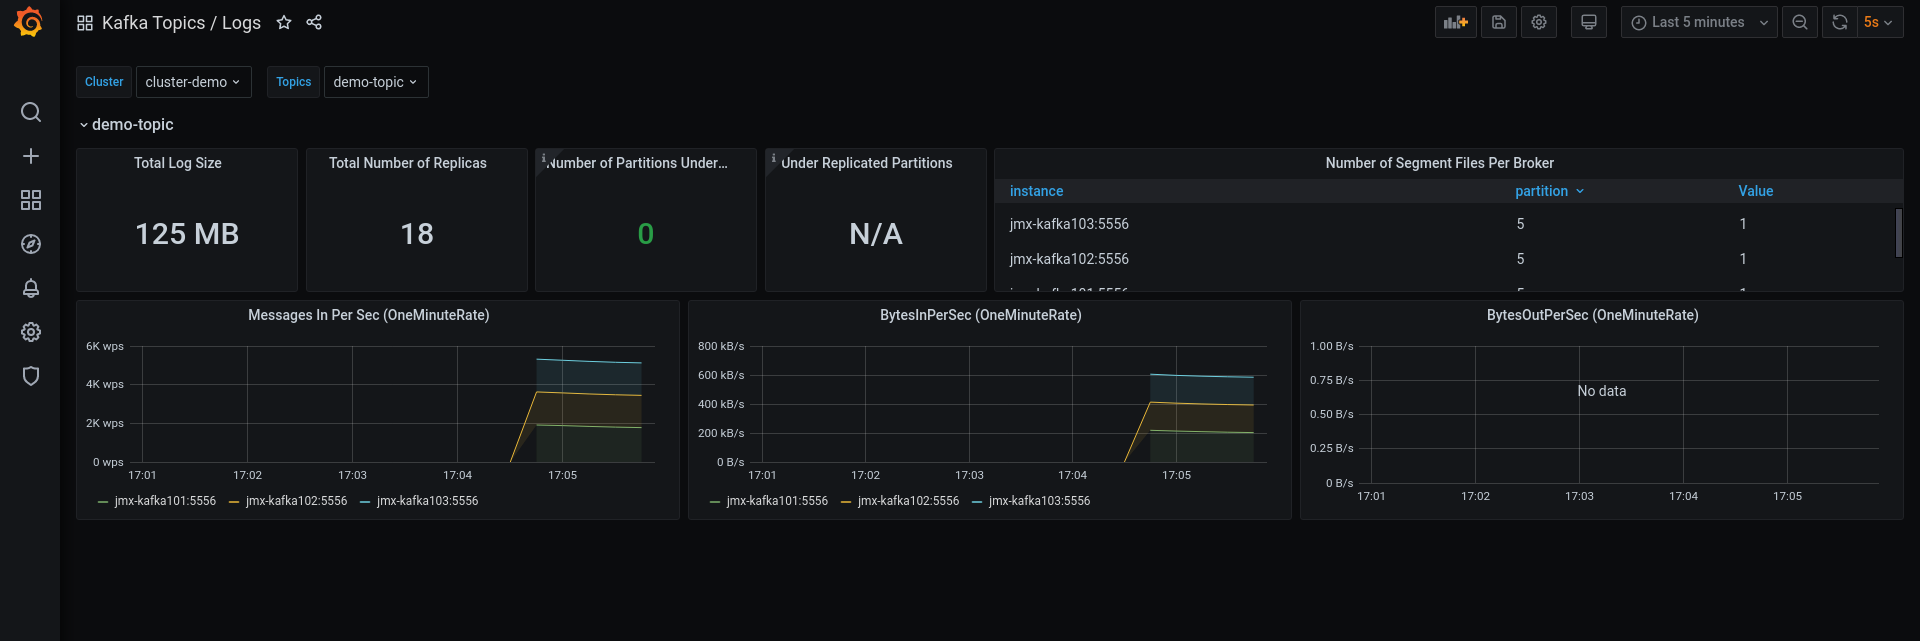
Open your favorite web browser and open one of the provided Grafana dashboards :
-
Kafka Cluster / Global Health Check
-
Kafka Cluster / Performance
-
Kafka Cluster / Zookeeper Connections
-
Kafka Cluster / JVM & OS
-
Kafka Cluster / Hard disk usage
-
Kafka Cluster / Topic Logs
Grafana is accessible at the address : http://localhost:3000
Security are :
-
user :
admin -
password :
kafka
Prometheus is accessible at the address : http://localhost:9090
Copyright 2020 StreamThoughts.
Licensed to the Apache Software Foundation (ASF) under one or more contributor license agreements. See the NOTICE file distributed with this work for additional information regarding copyright ownership. The ASF licenses this file to you under the Apache License, Version 2.0 (the "License"); you may not use this file except in compliance with the License. You may obtain a copy of the License at
Unless required by applicable law or agreed to in writing, software distributed under the License is distributed on an "AS IS" BASIS, WITHOUT WARRANTIES OR CONDITIONS OF ANY KIND, either express or implied. See the License for the specific language governing permissions and limitations under the License


