model-metrics-plot
model-metrics-plot(mmplot)
😎 About
This project is developed based on libraries such as Pandas and Matplotlib, and can be used to draw line graphs of multiple index parameters such as algorithm accuracy and speed of multiple deep learning models.
🥰Result
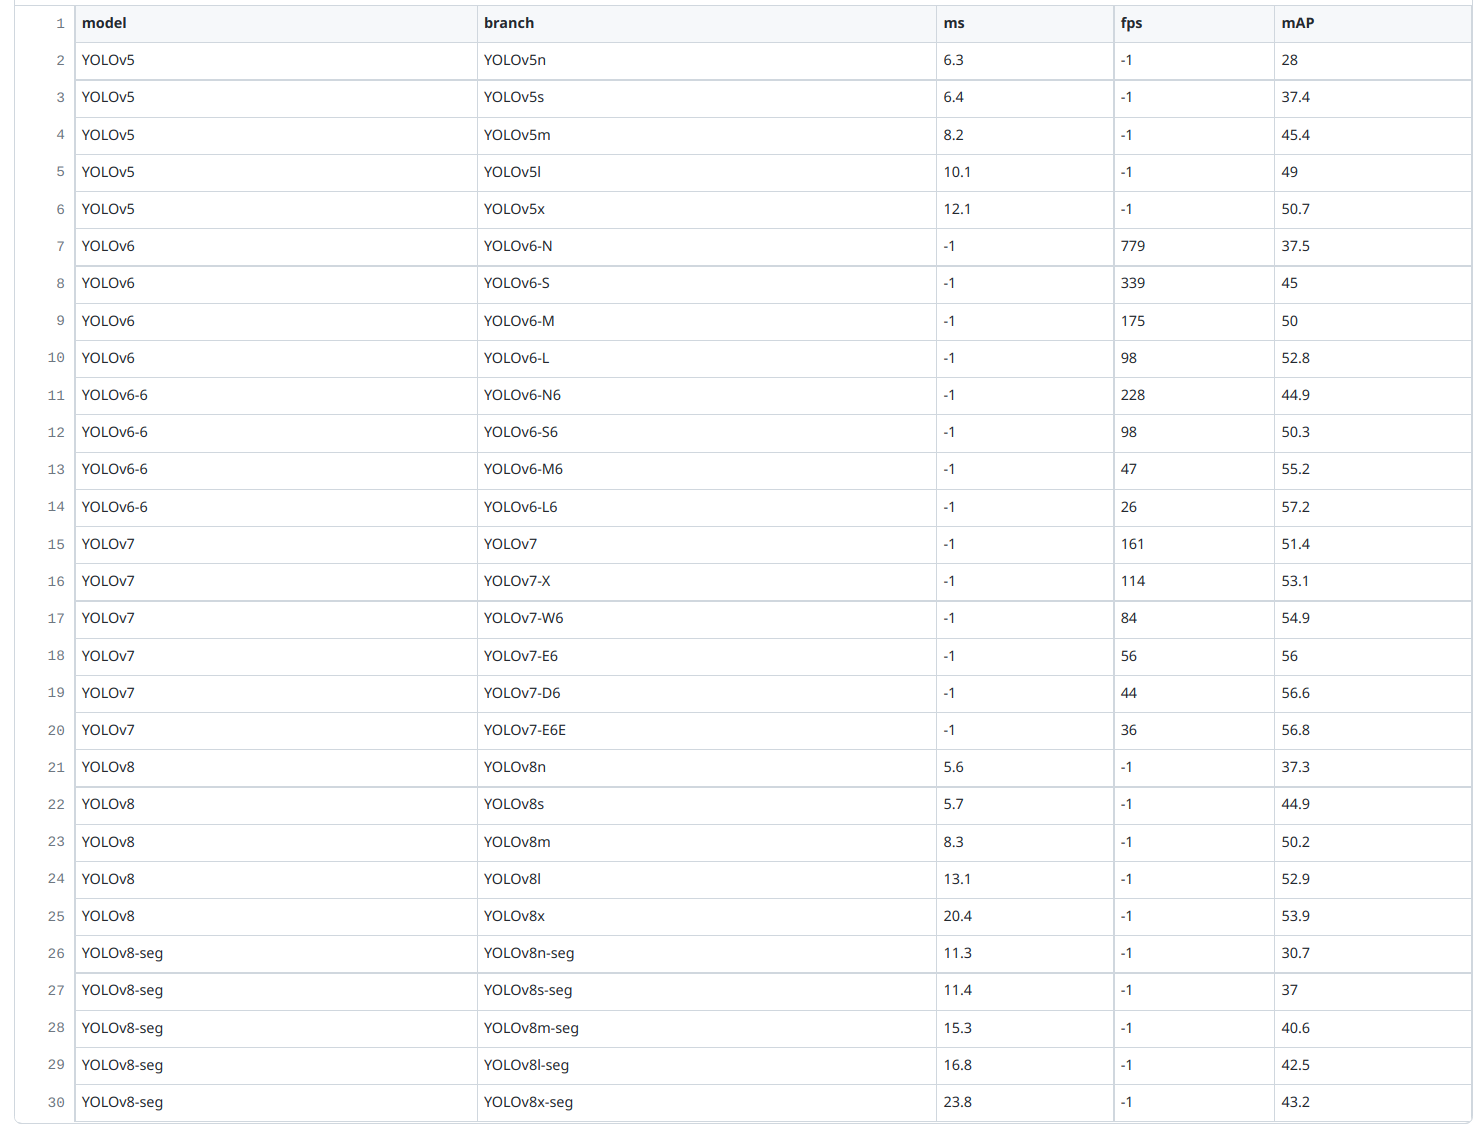
data review
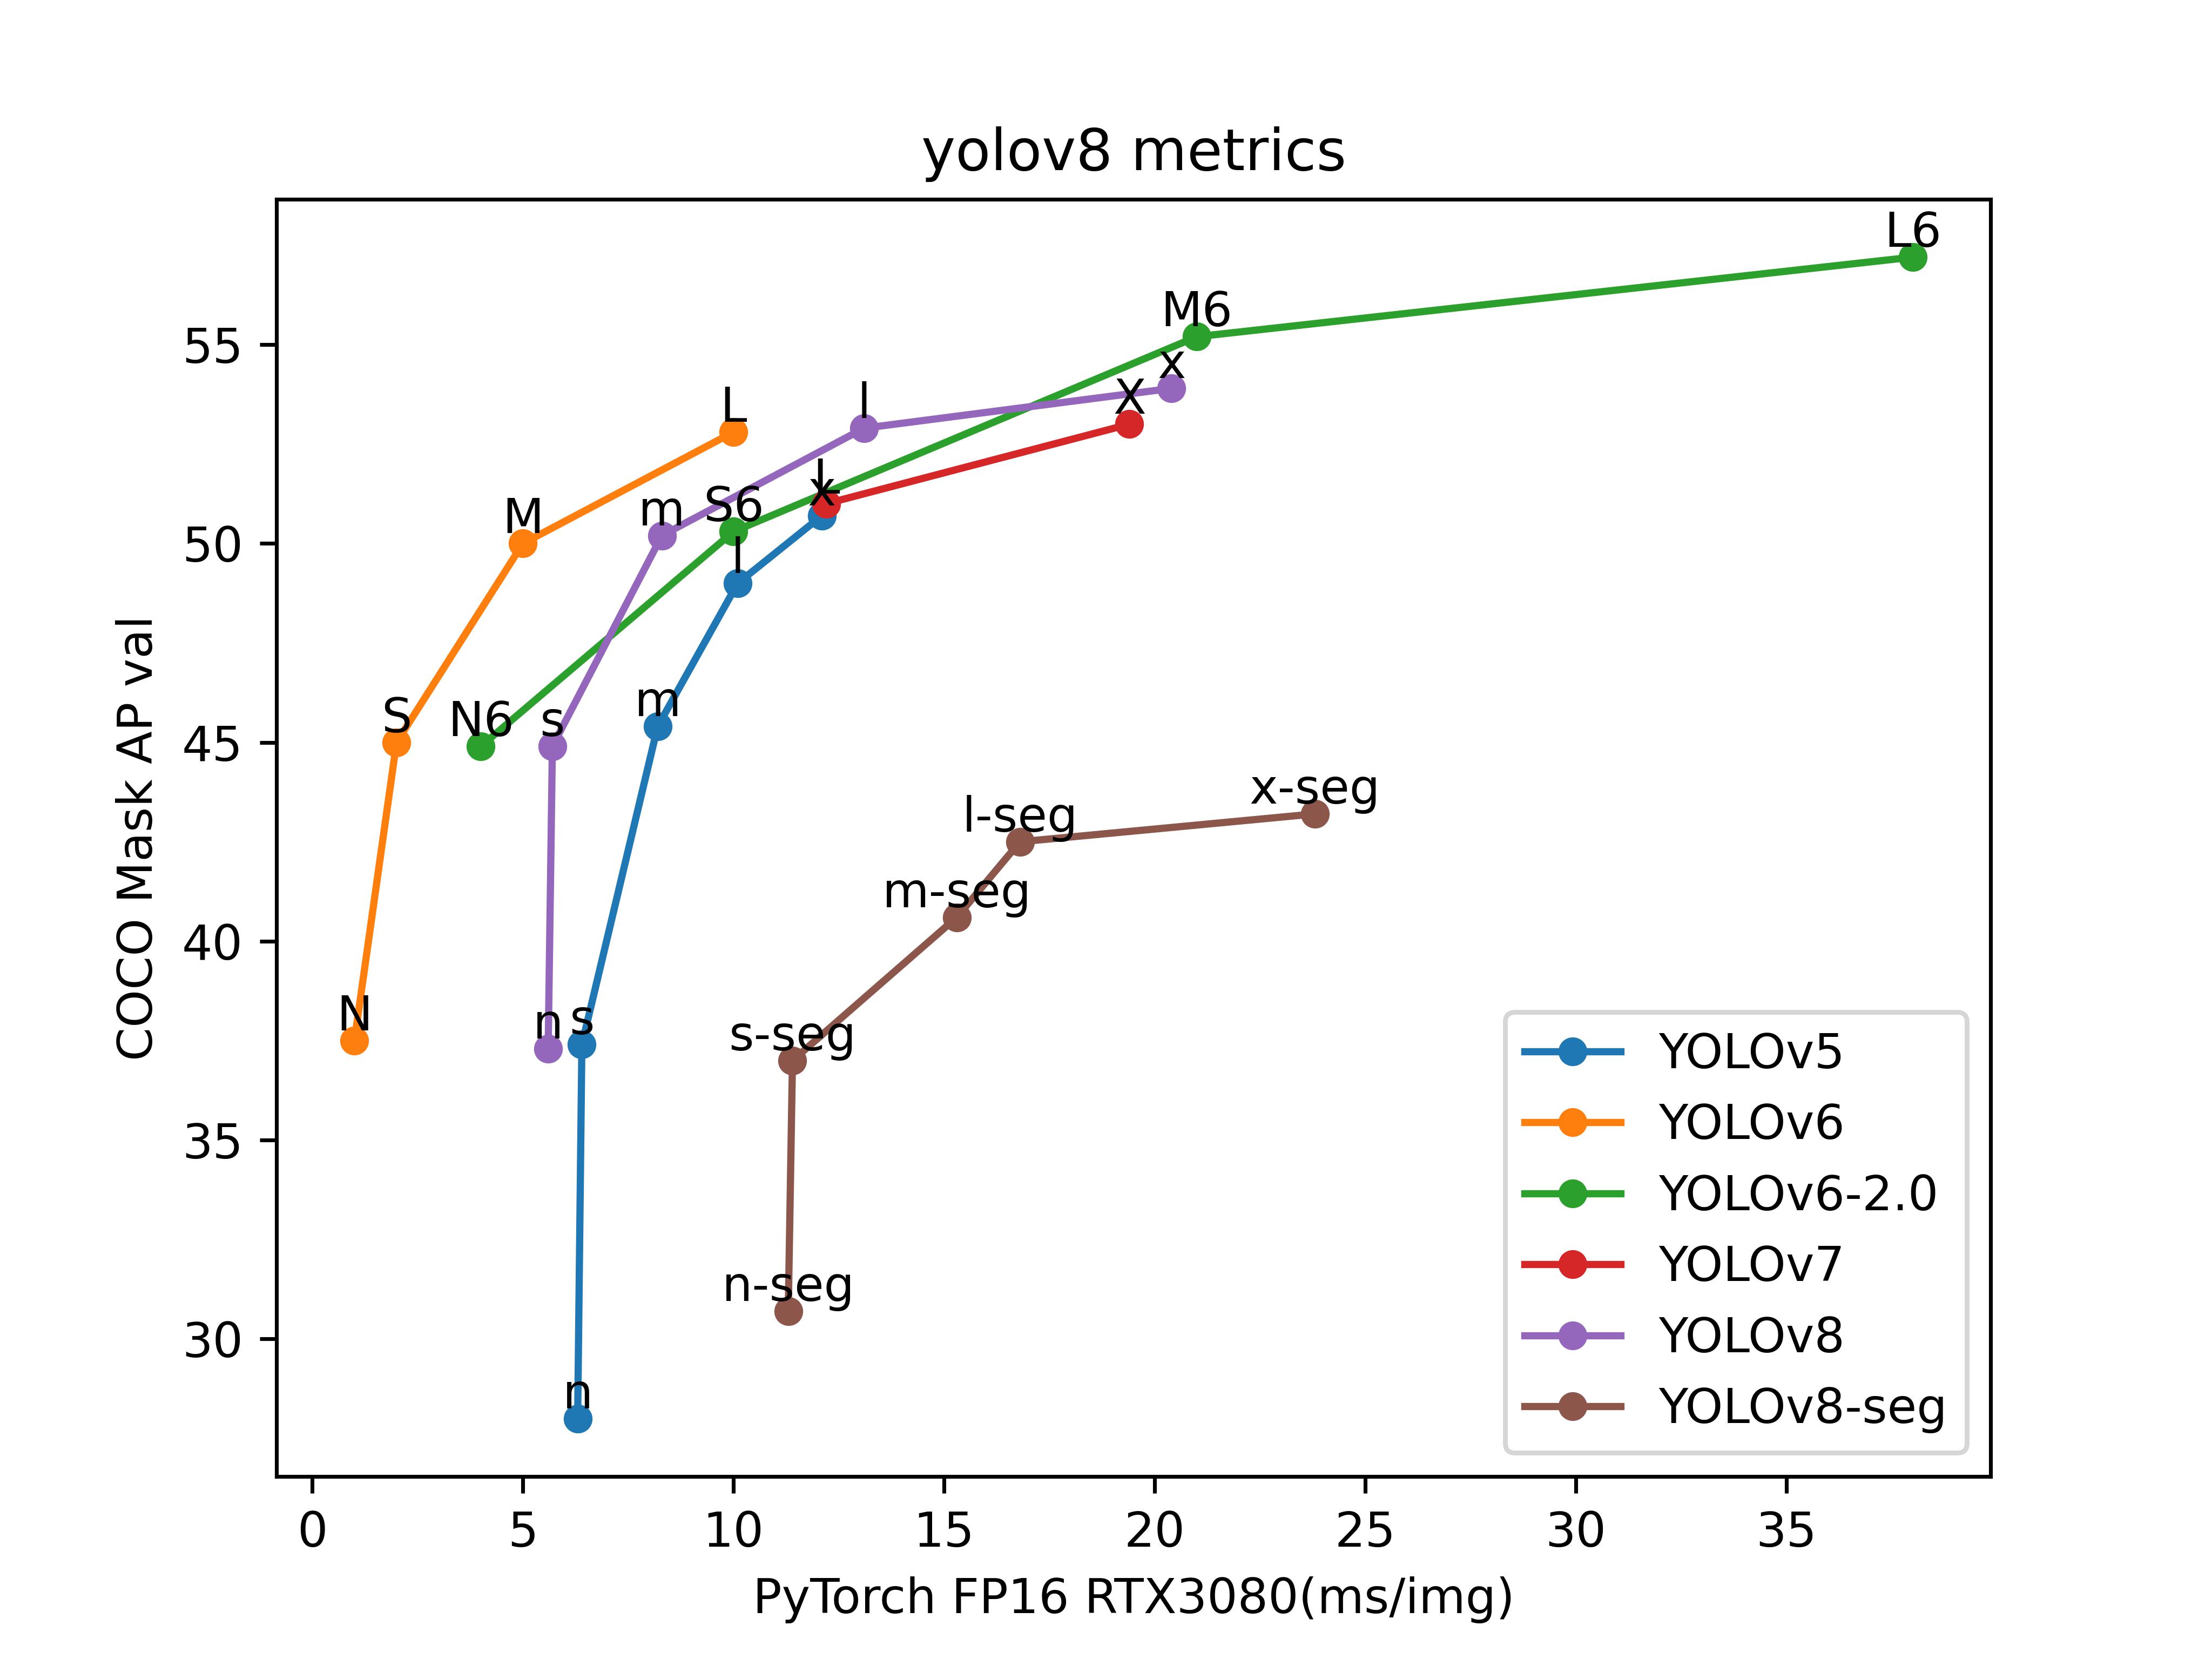
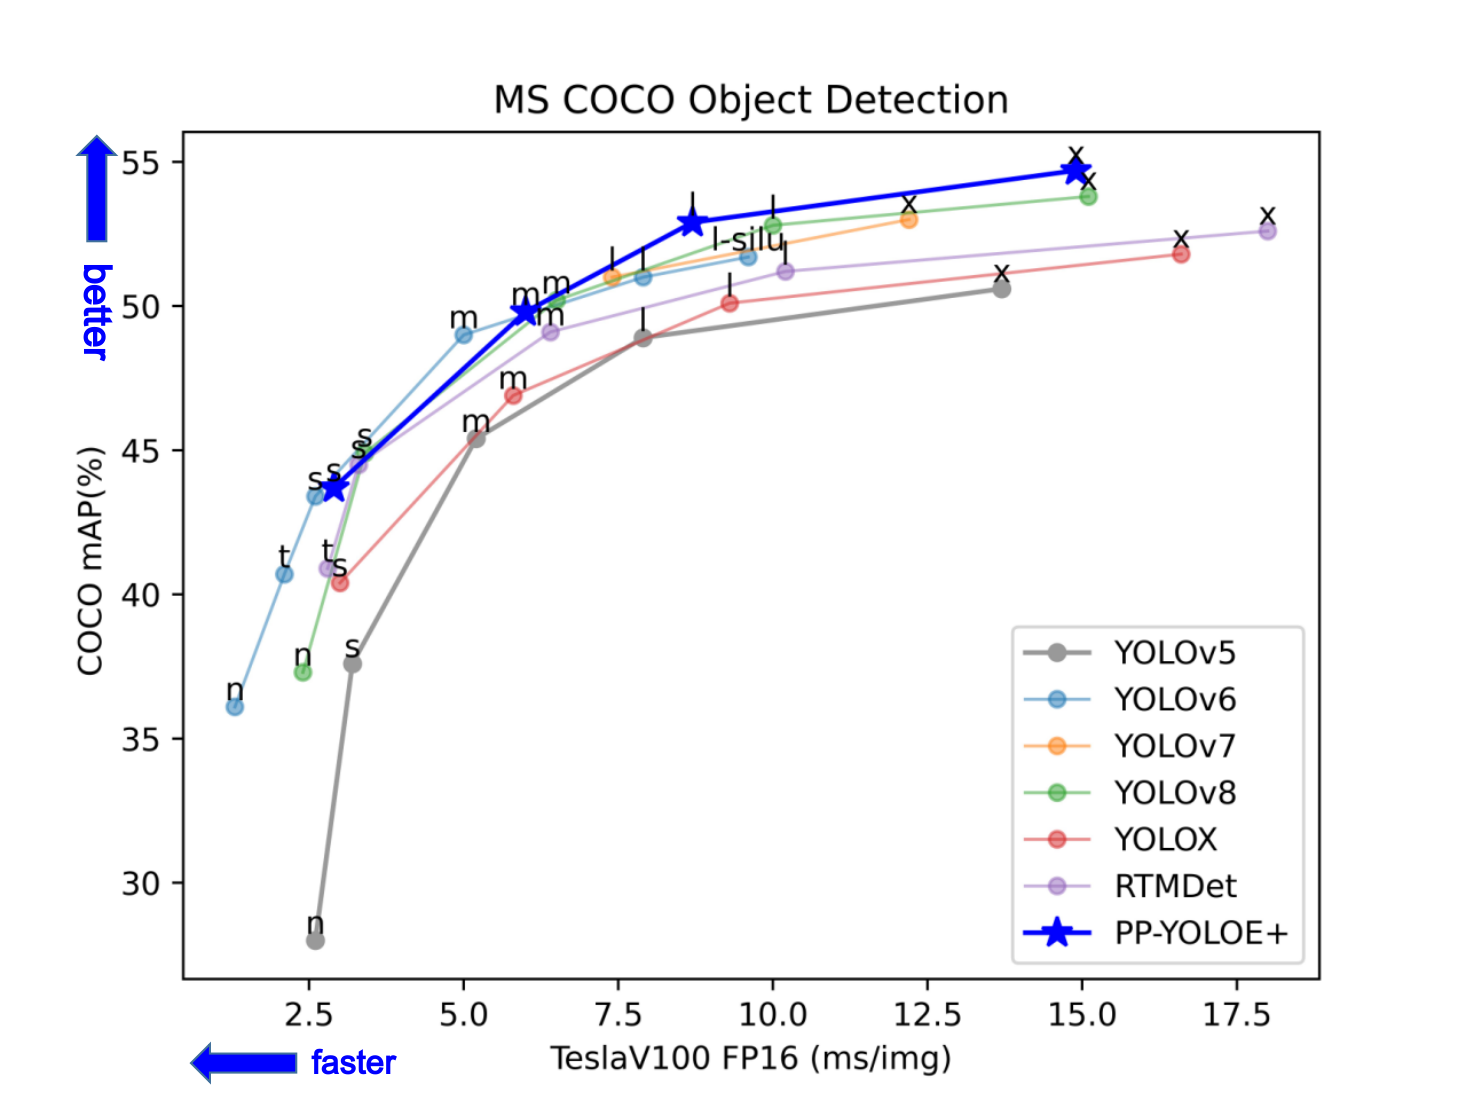
plot result
- data:data/Pytorch_models_data.csv
data:data:data/PaddleYOLO_models_data.csv
🔨Usage
requirement
pip install matplotlib
pip install pandas
run
git clone git@github.com:isLinXu/model-metrics-plot.git
cd model-metrics-plot
python3 main.pyor use your custom data csv
python3 main.py -c 'csv_path' -n 'figture_name' -t 'title_name' -x 'xlabel_name' -y 'ylabel_name' -f font_size python3 main.py -c data/model_data.csv -n 'plot.jpg' -t 'MS COCO Object Detection' -x 'PyTorch FP16 RTX3080(ms/img)' -y 'COCO Mask AP val' -f '10'


