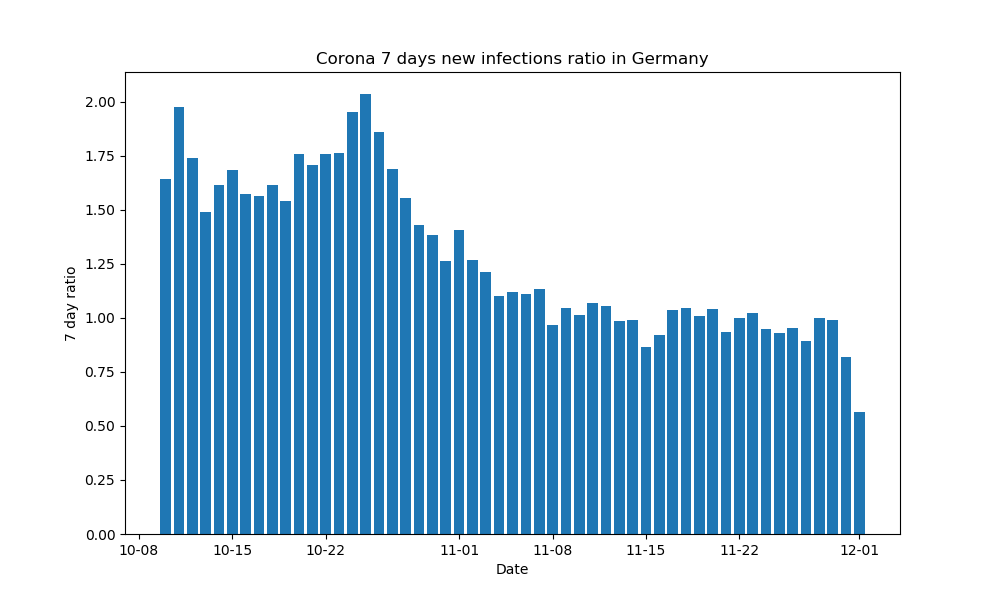
This repo provides a small script to visualize the Corona 7 days infections ratio
How to read the plot
A bar for a date e.g. the 10-17 is calculated as follows: (total_infections_on_10-17 / total_infections_on_10-10)
This result provides a ratio to compare the infection rate from the previous week on the same day. For example, fewer cases are reported at the weekend than during the week.
How to run the script
python visualize_infections_ratio.py
