Need to fill in the blanks.
You can repeat this analysis by using rtweet if you are within 9 days of the conference (twitter has a ~9 window on searching into the past).
I think it's always good to nod back to where you are grabbing code from; there is no (or should be) no shame in it. I've reinvented enough bad wheels that I'm happy to use someone else's better code when I recognize it and their license is cool with it.
So: much of this code is based of Mike Kearney's analysis of the rstudio::conf tweet repo.
The network plot comes from Bob Rudis's great 21 recipes for twitter which has a bunch of nuts and bolts recipes for things you would want to do day to day in social network analysis with twitter data, using rtweet.
For the code please go to the Rmd; it will have the R code and plots interwoven.
This README just has the plots.
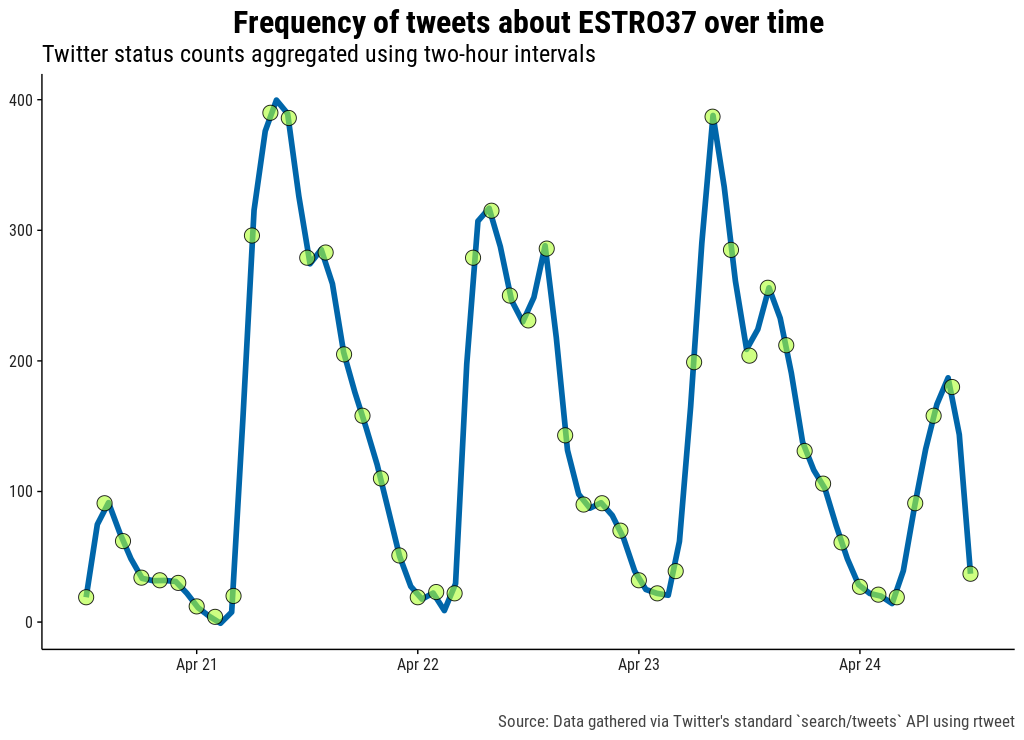
timecourse:
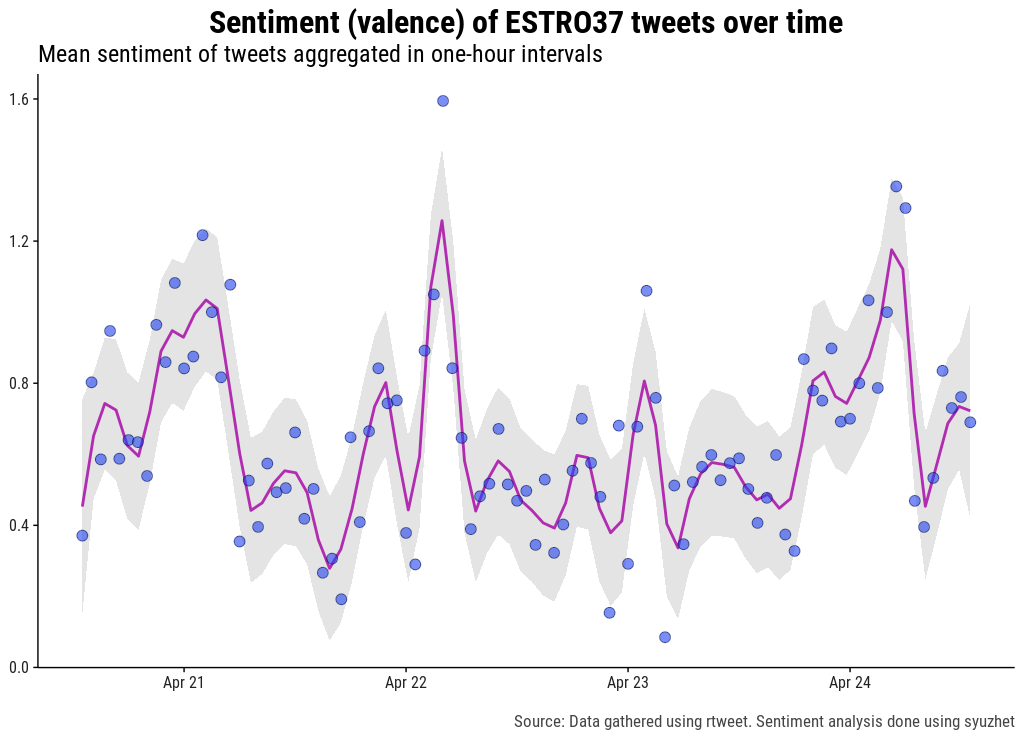
sentiment (how many positive vs negative words are being used during a given period):
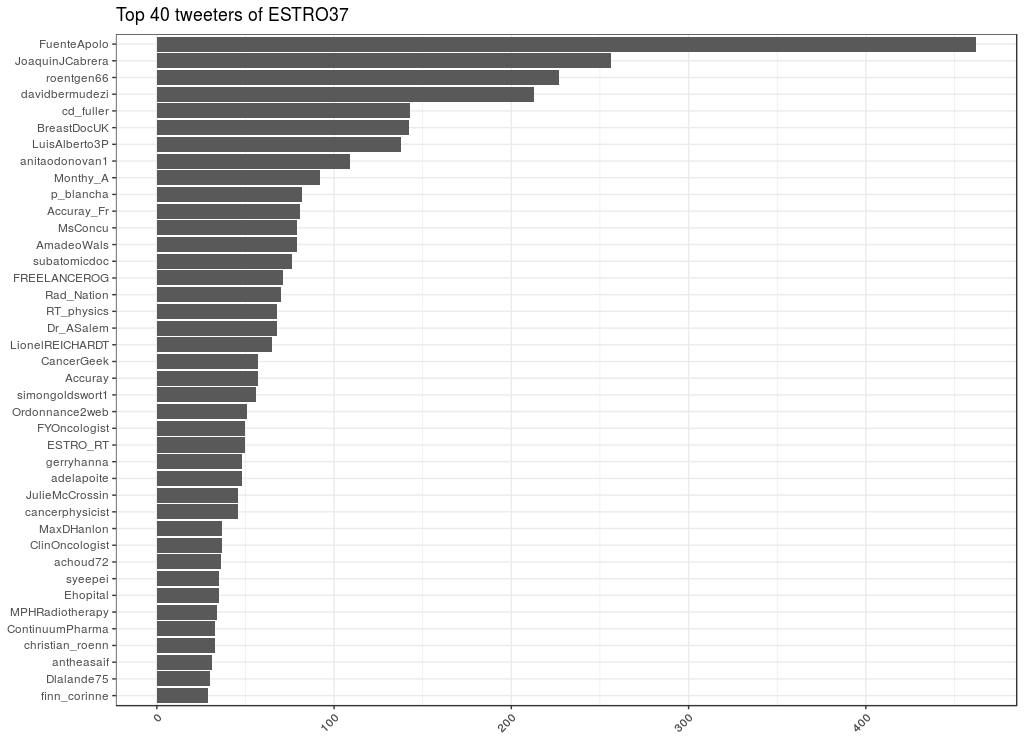
top 40 tweeters:
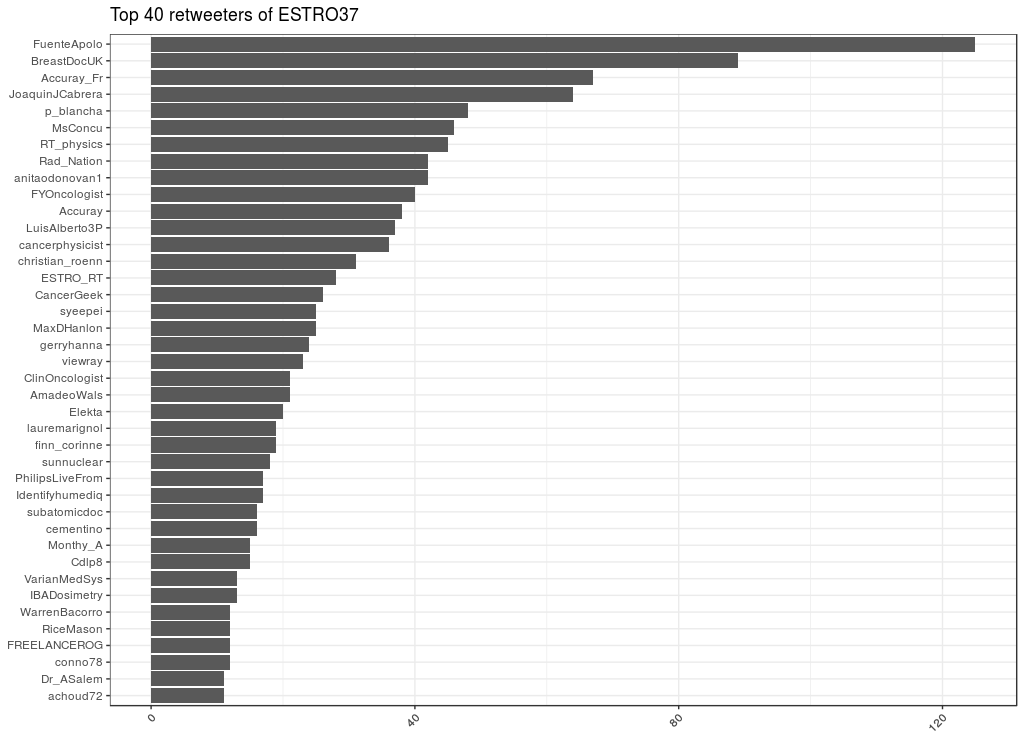
top 40 retweeters:
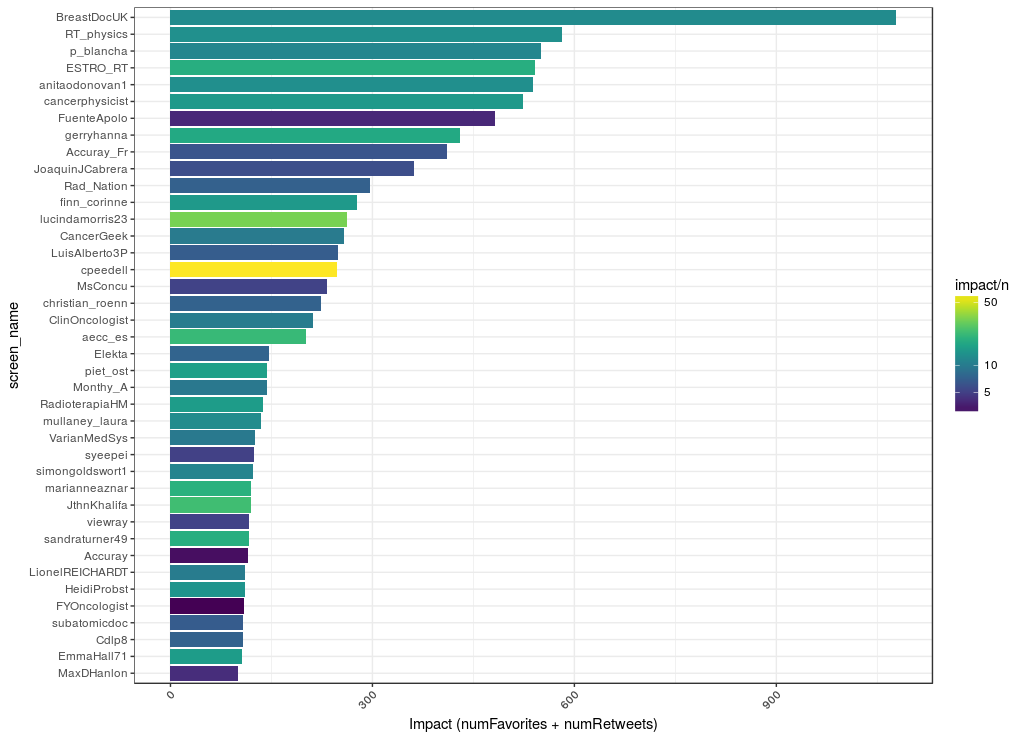
infuence (how many favorites and RTs did a person get? color divides "influence" by number of tweets to (poorly) adjust for prolific tweeters:
wordcloud (hate AND appreciate!):
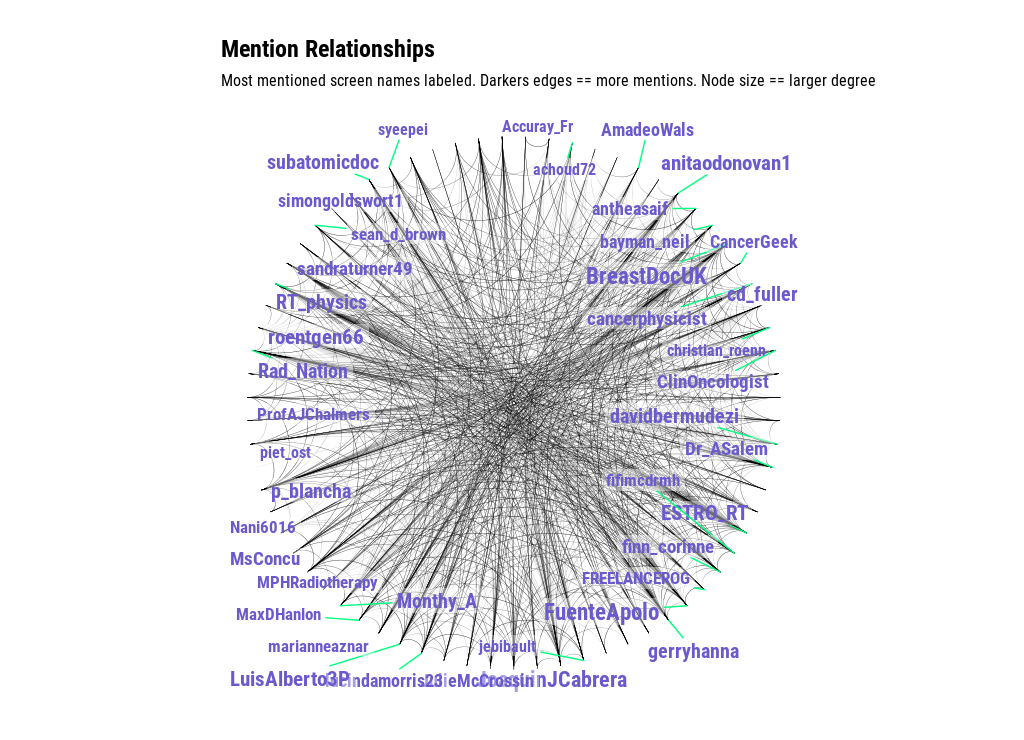
mention network:
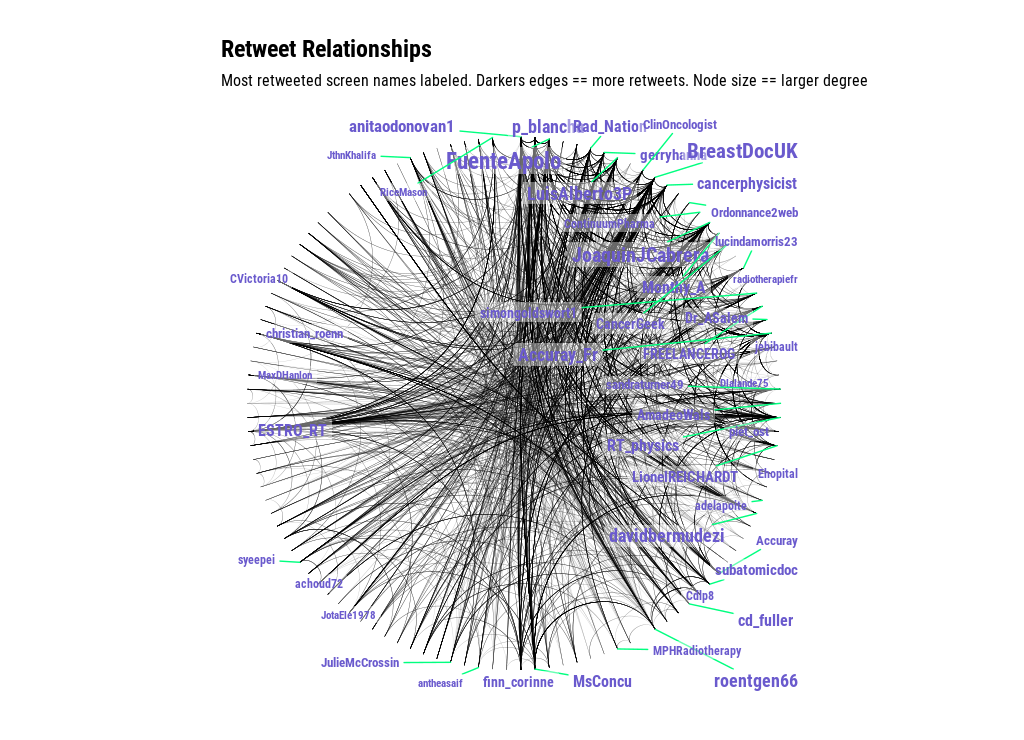
retweet network:
