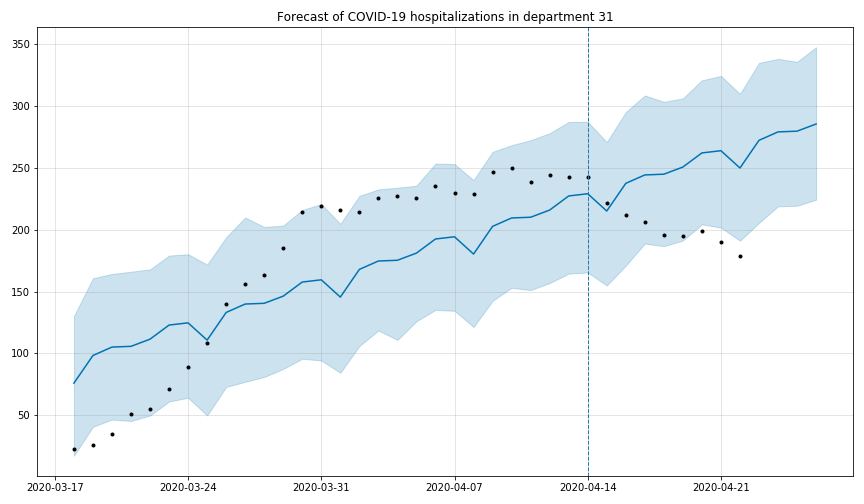
Visualize a forecast of the evolution of the COVID-19 hospitalizations in a given French department + forecast of the total number of deaths
COVID-19 and geographical data come from the French open data portal
Data are stored as pandas / GeoPandas dataframes
Forecast of time series (number of hospitalizations per department) is realized with Facebook Prophet
Graphical visualization is realized with matplotlib
Example: forecast of the number of COVID-19 hospitalizations in a French department
Example: forecast of the total number of (new) deaths in France
Run the demo-hosp_dept notebook to build the forecast of hospitalizations on a specific department. Run the demo-death notebook to build a forecast of deaths in France.
-
Prophet - Open source software (Facebook) for forecasting time series
-
pandas - Python Data Analysis Library
-
GeoPandas - GeoPandas is an open source project which extends the datatypes used by pandas to allow spatial operations on geometric types.
- Thomas Dubot
This project is licensed under the MIT License - see the LICENSE.md file for details
COVID-19 data are shared on the French open data portal
More information here: https://www.data.gouv.fr/fr/datasets/donnees-relatives-a-lepidemie-du-covid-19/

