get smallRNAseq summary in piclusters, transposons and genes from bed2 files generated by piPipes or other softwares
For easy install, run install.sh in bed2_summary folder after download and unzip the source code. It will add all the scripts needed into your PATH and PYTHONPATH. After installation, please use source ~/.bashrc or re-load the server.
After this, simple use run_bed2_summary to generate the summary of piPipes or mapping result.
bed2_summary need at least 4 input (first 4 parameters is required, others is optional):
- -c control sample name with directory. Use without -t will only give out plots for control sample. eg: path_to_piPipes_result/sample_name_control
- -o output directory. All the output files will be in this folder including bucket plots and summary. eg: results/piPipes/bed2_summary/
- -g genome used. default: dm3
- -n normalization method. default: miRNA
miRNA: normalized to reads per million mapped miRNA reads
uniq: normalized to reads per million mapped reads exclude miRNA and rRNA reads - -t treatment sample name with directory. If set, bed2_summary can make comparison between control and treatment
- -G how deep you want to analysis genes. default: 1
0.) not analysis
1.) get normalized srna reads number and species for each gene
2.) also get buckets for each genes. It may takes more than 2 hour and the buckets pdf size may be more than 200M - -p CPU numbers used in bed2_summary
tips:
In bed2_summary, the input need to be piPipes_output_folder/sample_name.
For example: To say if you used piPipes small -i oreR_unox.cutadapt.fq.gz -o /project/common/piPipe.result/, then the follow command is needed for bed2_summary:
run_bed2_summary -c /project/common/piPipe.result/oreR_unox.cutadapt.fq.gz -o [which output folder you want to put the figures and summaries] -g dm3 -n [miRNA or uniq] [-G if you want to include gene analysis]
Also, if you want to compare two conditions, like if you have ran piPipes for two conditions:
piPipes small -i oreR_unox.cutadapt.fq.gz -o /project/common/piPipe.result/
piPipes small -i rhino_KO_unox.cutadapt.fq.gz -o /project/common/piPipe.result/
Then you can run:
run_bed2_summary -c /project/common/piPipe.result/oreR_unox.cutadapt.fq.gz -t /project/common/piPipe.result/rhino_KO_unox.cutadapt.fq.gz -o [which output folder you want to put the figures and summaries] -g dm3 -n [miRNA or uniq] [-G if you want to include gene analysis]
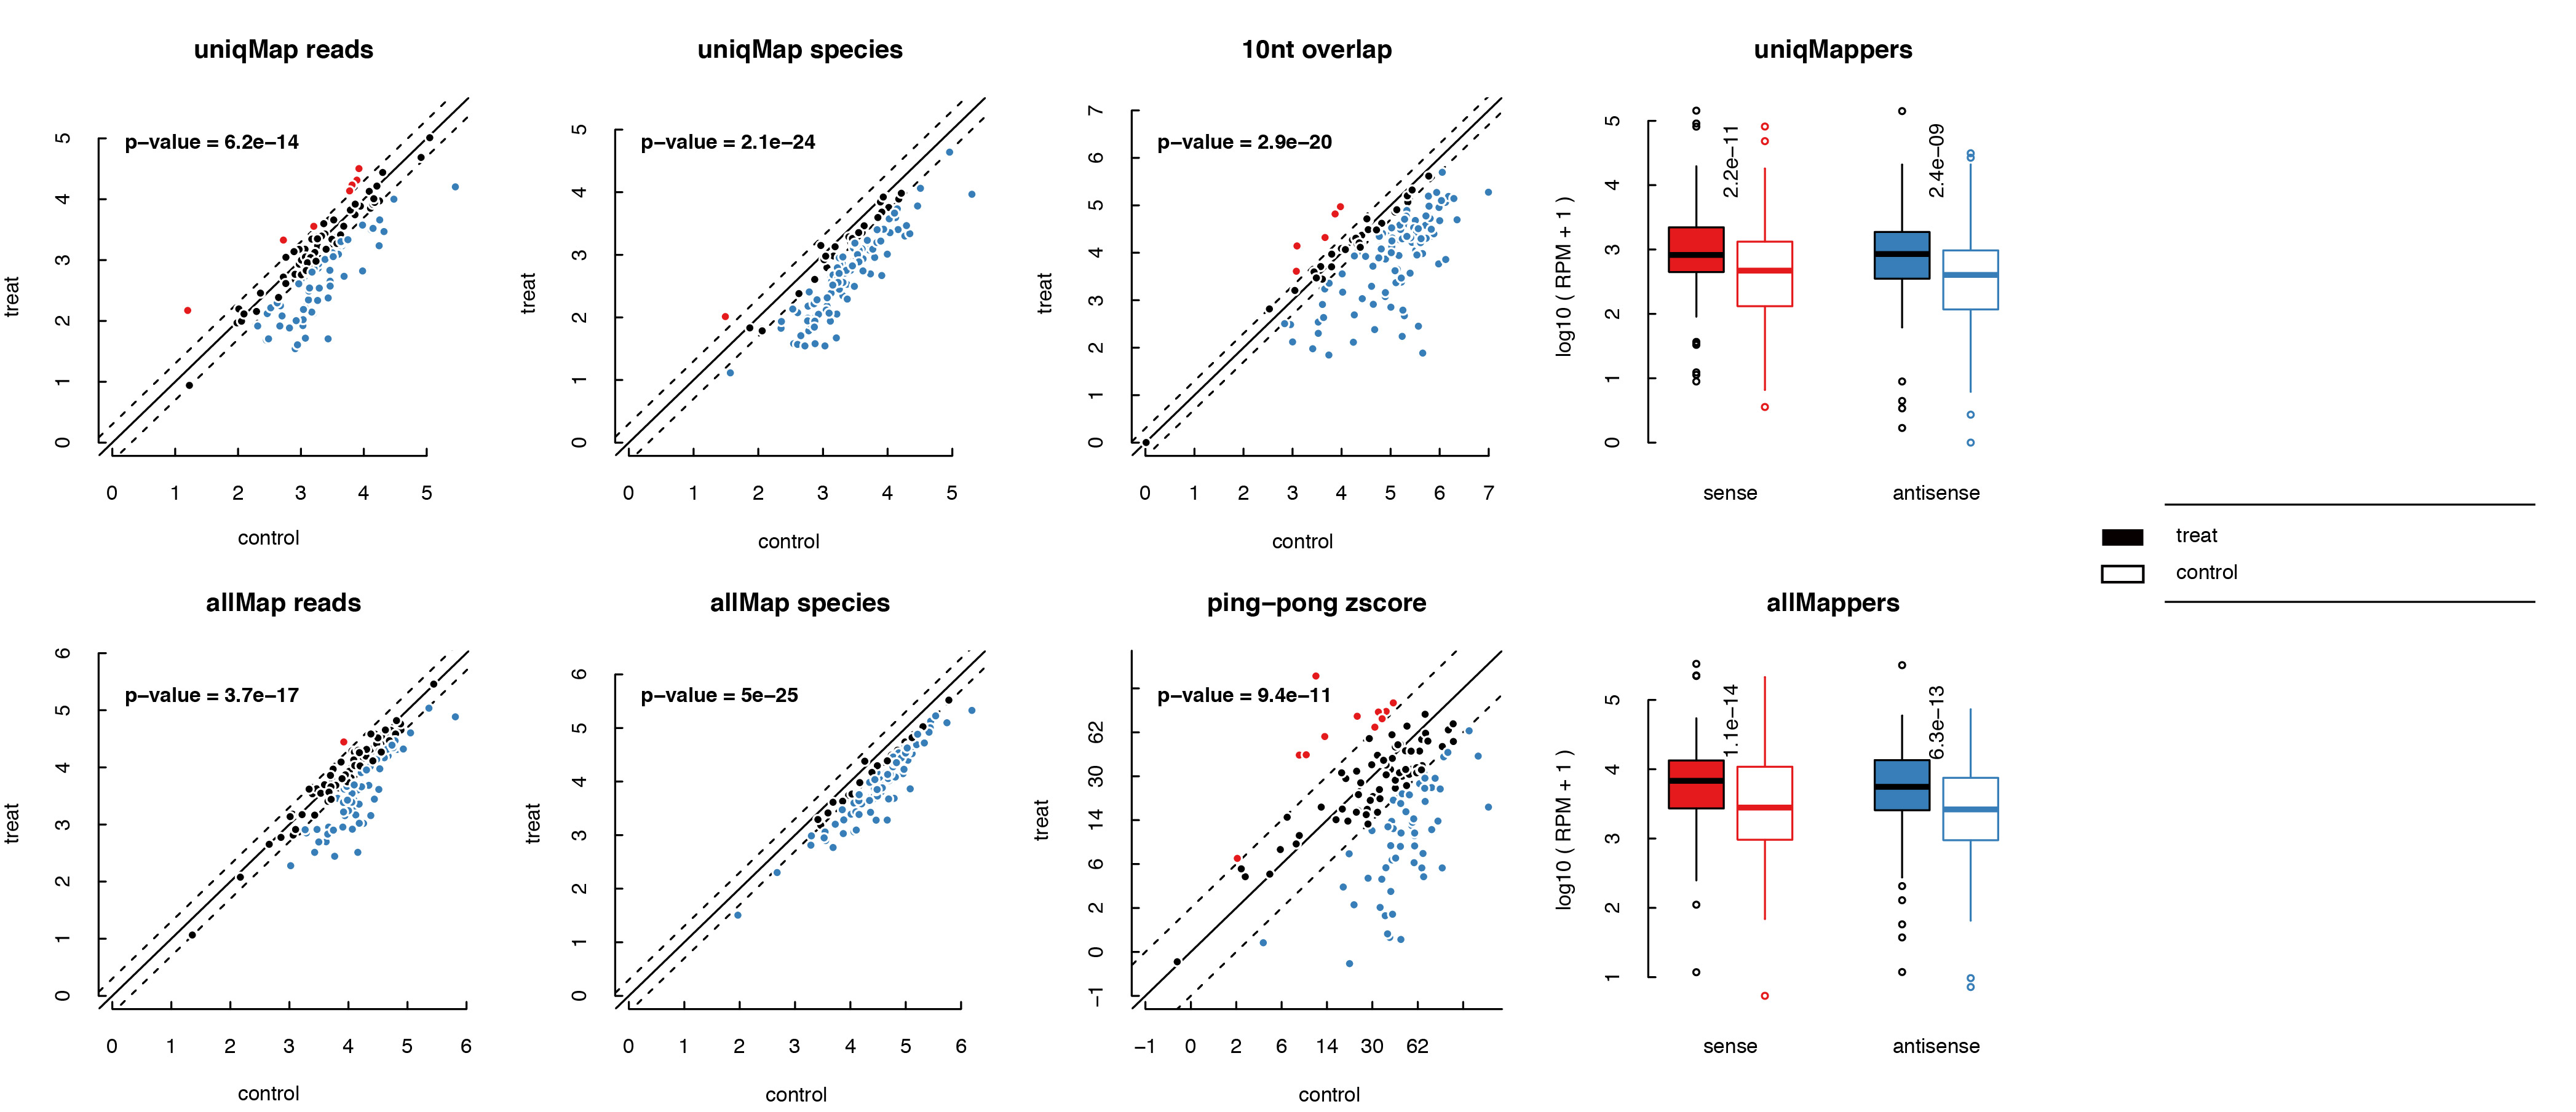
bed2_summary can give three summary files: prefix.picluster.summary, prefix.transposon.summary and prefix.gene.summary which summarize informations for each picluster, transposon or gene in each row. And there are 10 columns in xxx.summary:
- normalized sense+unique mapped reads.
- normalized antisense+unique mapped reads.
- normalized sense+all mapped reads.
- normalized antisense+all mapped reads.
- normalized sense+unique mapped small RNA species.
- normalized antisense+unique mapped small RNA species.
- normalized sense+all mapped small RNA species.
- normalized antisense+all mapped small RNA species.
- ping-pong zscore
- normalized 10nt overlapped read pairs
bed2_summary can also output bucketplot, scatterplot and boxplot for piclusters, transposons and genes respectively. In the plot files, ping-pong score, length distribution and signal profile for each element is included.

please send questions or bugs to yutianxiong@gmail.com
