Tianyi Wang
2020 Apr
This is a Capstone project for Udacity Data Science Nanodegree parterning with Arvato Financial Services. In this project, demographics data for customers of a mail-order sales company in Germany is provided along with the demographics information for the general population. We'll use unsupervised learning techniques to perform customer segmentation to identify the parts of the population that best describe the core customer base of the company. Then, we'll build a machine model to predict which individuals are the most likely to respond to the company's mail campaigns.
- pandas
- sklearn
- matplotlib
- seaborn
The raw data is proprietary so I won't share it in this repo. We mainly have 2 datasets which contain the demographic features for the general German population and the customers seperately. The customers data is like a subset of the general population data with 3 extra columns: CUSTOMER_GROUP, ONLINE_PURCHASE and PRODUCT_GROUP.
- Genereal German population data: 891,221 rows, 366 columns
- Customers data: 191,652 rows, 369 columns
The 366 features cover various aspects that describe a customer, including age, customers journey typology, financial typology, bank transaction activities, customer personalities, shares of different car brands in the customer's neighborhood. Interestingly, most features are built around the cars the customer owns or the cars the customer's neighbors own.
An example of the features:
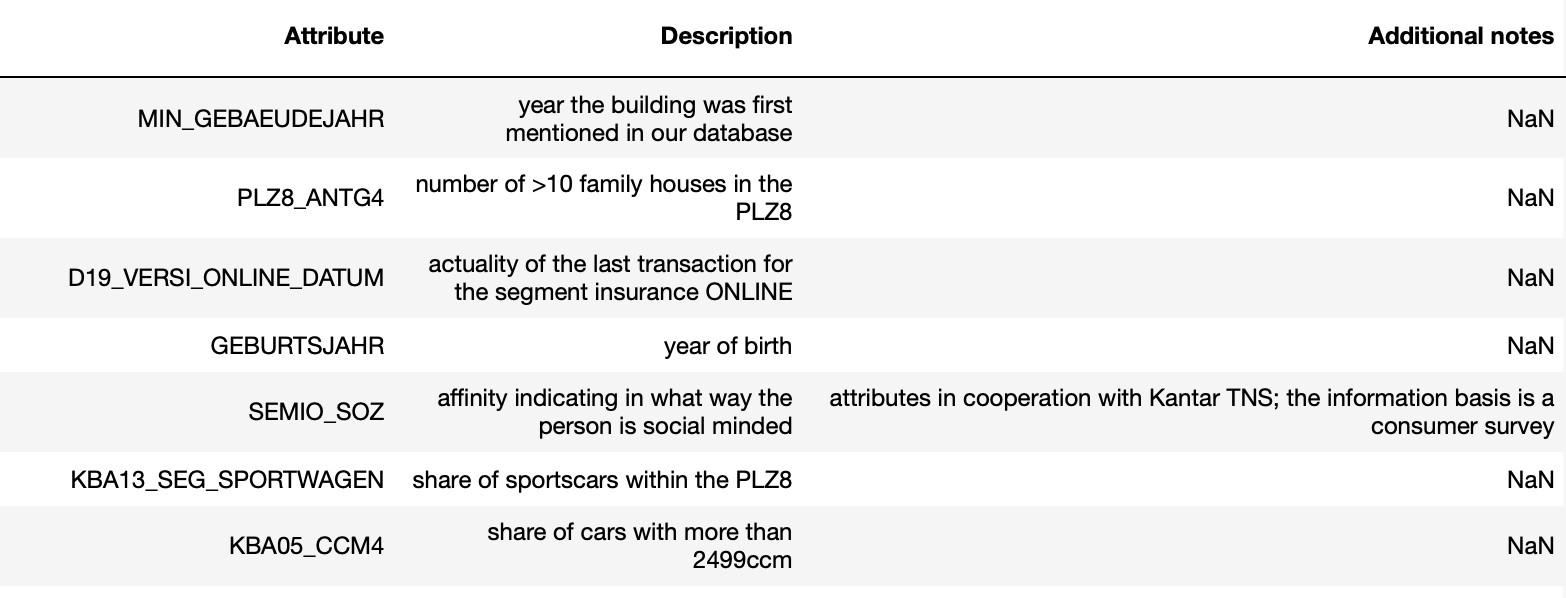
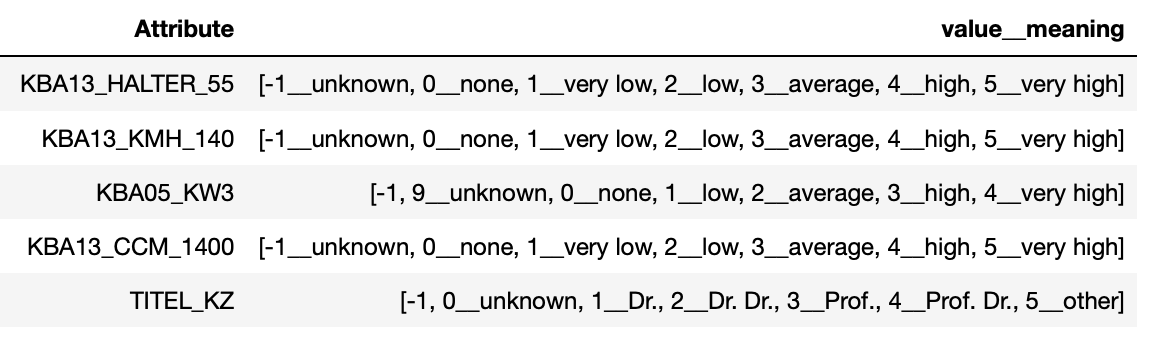
Most of the features are ordinal categorical variables like this:
In our notebook 01 Data cleaning and feature engineering we will explore and understand the demographic data and perform data cleaning process on the general German population data. We will create a python class for the data cleaning process and save the fitted Imputer and StandardScaler so that they can all be used directly on the customers data. (We will compare customers data with the general population later, so we want to keep the data transformation consistent).
Unlike other segmentation problems, in this project we will perform a KMeans clustering on the general population and then fit the KMeans model on the customers data. We would like to see which clusters are more likely to be customers by compaing the clusters distribution of the general population with that of the customers.
Since we have many features, we will perform a PCA transformation on the demographic data to reduce the dimensions before we do the KMeans clustering. The process can be found in notebook 02 PCA. We chose to keep the first 100 components, which explain 70% of the variance. By looking at the top and bottom 3 features that make up the components, we tried to understand what each component means:
- First component: Low mobility, 1-2 family houses in the PLZ8, low share of AUDI within the PLZ8.
- Second component: High online affinity and high recent transaction activity
- Third component: High share of BMW & Mercedes Benz, high share of upper middle class cars and upper class cars (BMW5er, BMW7er etc.), low share of small and very small cars (Ford Fiesta, Ford Ka etc.) in the PLZ8, low share of cars with max speed between 140 and 210 km/h within the PLZ8, low numbers of cars with 5 seats in the PLZ8
- Forth component: Low "financial typology: be prepared", older age, highly likely to be money saver or investor
We extracted the top 2 features (that can be found explanations) for the top 20 components. They are considered as "important features" and when we do clustering later, we will look at these features to understand the clusters.
In the KMeans clustering, we chose to do 6 clusters. The average values of the important variables for each cluster:
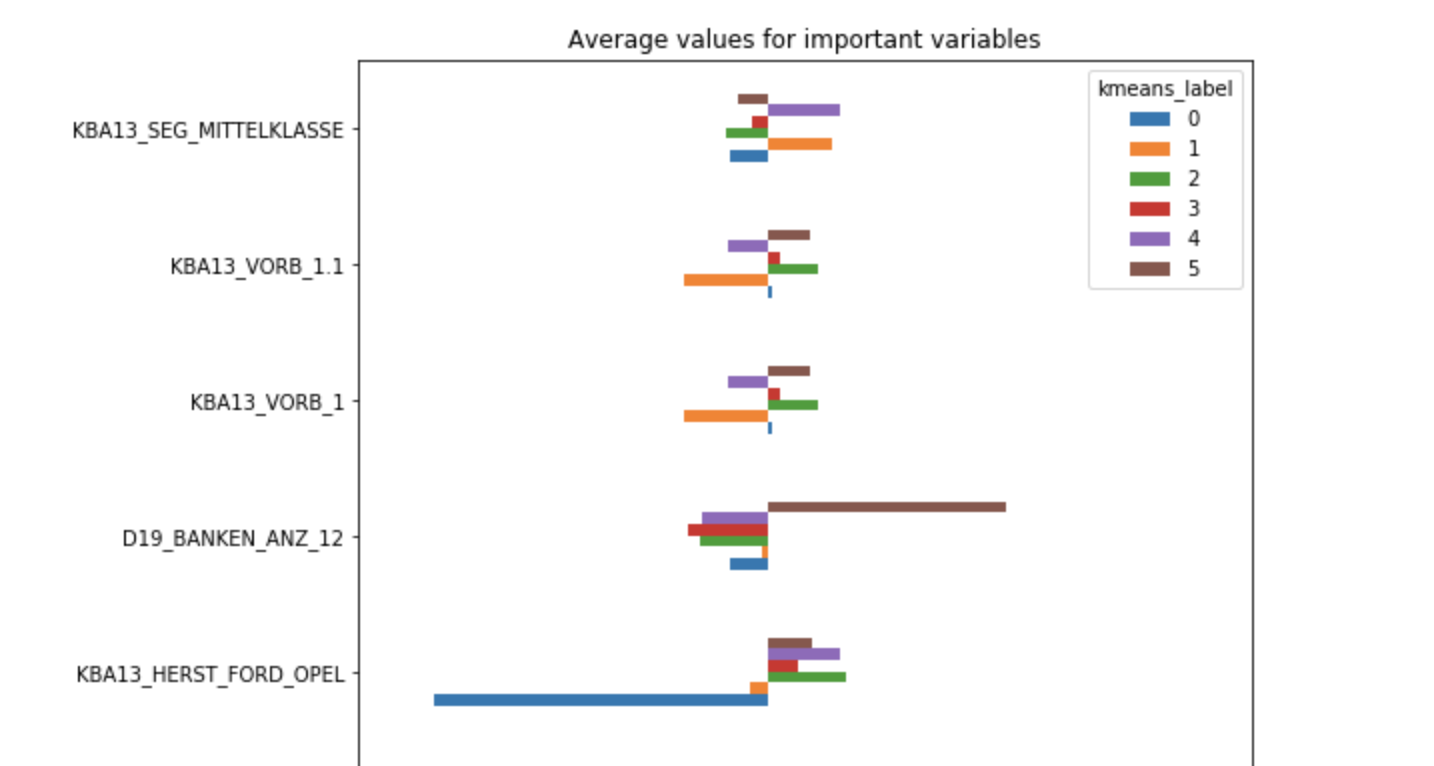
It's a very long chart I only screenshot a little bit here... For more details please check the notebook 03 Kmeans.
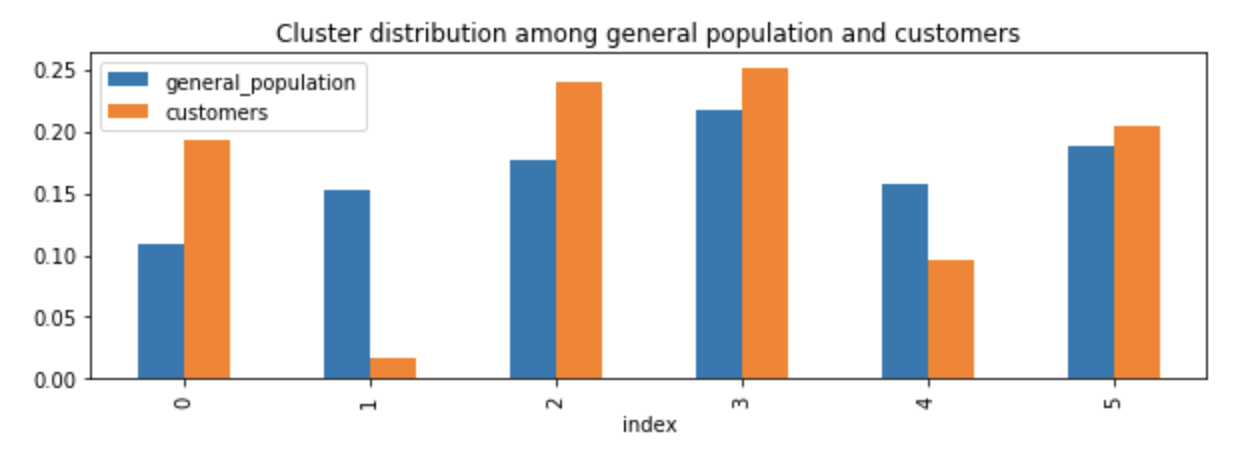
Comparing the clusters distributions of the general population and customers. We can see that people from cluster 0 are very likely to be customers. These people have lower share of Ford & Opel/Vauxhall within the PLZ8, but higher share of BMW & Mercedes Benz within the PLZ8 and higher share of car owners elder than 61 within the PLZ8; The most common engine size in the microcell is more likely to be bigger engine; The most common car segment in the microcell is more likely to be upper class cars; We can infer that people in cluster 0 are older, rich, upper class people who prefer BMW & Mercedes Benz and cars with bigger engines.
Cluster 1 is much less likely to be customers. These people are more likely to have high financial typology -- be prepared, high moving patterns, high share of middle class cars (Ford Mondeo etc.) in the PLZ8, and low share of a lot of other important variables we are looking at. These people are more like younger middle class while their degrees of "financial typology be prepared" are high. They also have high moving patterns.
Cluster 2 and 3 are also more likely to be customers, while these clusters might be very different from each other. People in clusters 2 have low degree of "financial typology be prepared" and low moving patterns; People in cluster 3 have high affinity indicating in what way the person is dreamily and have high degree of "financial typology be prepared".
In this part we have a training set and a testing set, each with 42,962 rows and the same features as we have in the previous datasets. We want to use the training set to learn what kind of people are more likely to respond to our campaign.
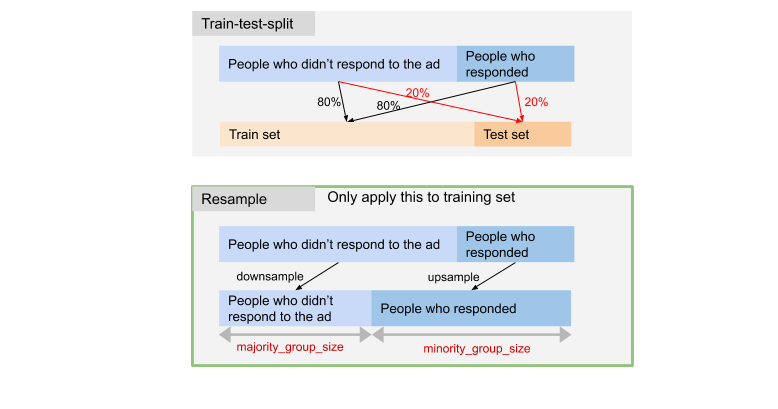
In the training data, only 1.2% (425 people) of the people responded to the ad. So we need to deal with the data imbalance issue. We wrote a customized function to do the job of train_test_split. We will sample 20% from the customers who responded to the campaign and 20% from the customers who didn't respond seperately to the final test set to make sure that in training set, 1.2% of the people responded and in testing set, that ratio is also 1.2%. When we train the model, we will upsample the people who responded and downsample the people who didn't respond.
We tried several models, including Random Forest, Gradient Boosting and the Xgboost algorithm. We found out that Xgboost worked the best. Our modeling process is mostly like this:
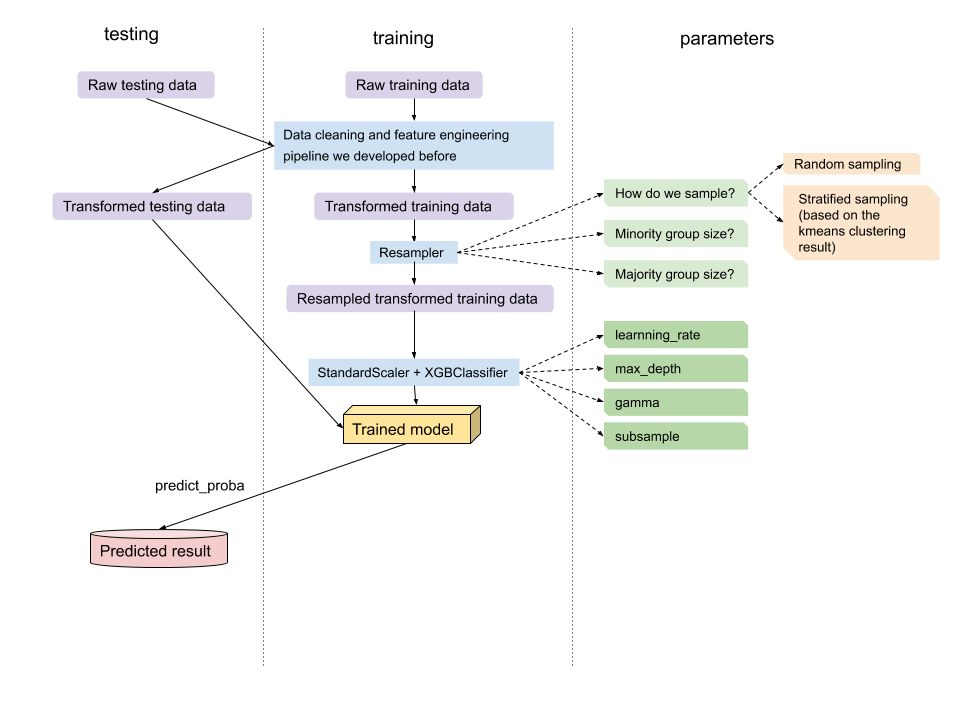
The green squares above are the tunable parameters (of course there are way more other parameters for XgbClassifier, we found these parameters the most influential). We split up the parameters into 2 groups: resampling parameters (squares in light green) and classifier parameters (squares in dark greens). We first tune the resampling parameters, and then fix the resampling parameters and tune the classfier parameters.
We used an algorithm which is close to 5 folds cross validation algorithm. Rather than spliting the data to 5 folds ahead and use one fold as validation set at one time, we randomly split data each time we run the model. I kind of trust this method because in our modeling pipine, only very small portion (no more than 10%) of the whole data will be entered to the training process. Even if we don't do very strict cross validation, there's very very little chance that the five sampled training sets are largely overlapped.
The objective for parameter tuning is that we want to maximize the AUC calculated with the real response labels and the predicted probability to have a positive label.
auc = roc_auc_score(y_test, model.predict_proba(X_test)[:,1])
For reference of the definition and meaning of the AUC metric, please check this link
Our best result came under this set:
- sampling method: random sampling
- minority group size: 1200 (on average, a positive case in the training data will be learned 3 times)
- majority group size: 1200
- learning rate: 0.01
- max_depth: 6
- gamma: 0.5
- subsample: 1 (don't drop any column!)
Remember that although positive cases will be repeatedly learned, there will only be about 3.6% negative cases entering the training process. Each time we train the model and predict on the validation set, the result could be different. So when we actually predict on testing set, we will train the model for multiple times, predict on testing set with the models and then use the average predicted value as the final result.
Finally there's an online Kaggle competition for submitting the result.
By far, the best AUC score I had is 0.80352 (the highest score on the leaderboard is 0.81063)

A final topic is the important features in this model. The most important attributes are the customer's transaction activities in the last 12 months (in the SOZIALES category, in German it means "social"), number of academic title holder in building, share of cars with Diesel-engine in the microcell, share of newbuilt cars (referred to the county average) - PLZ8 and consumption type. People who responded to the ad have lower transaction activities in the "social" category, higher numbers of academic title holders in building, higher share of cars with Diesel-engine in the microcell and higher share of newbuilt cars (referred to the county average) - PLZ8.