Starbucks ad campaign optimization
Tianyi Wang
2020 Jan 5th
This project, from Udacity Data Scientist Nanodegree, originally was a take-home assignment provided by Starbucks. In the assignment, the result of an advertising promotion experiment is provided for us to understand what patterns in the customer features indicate that a promotion should be provided to improve not only the conversions but also the profit. The notebook in this repo provides my solution.
Overview and Problem Statement
The background of the study is that an advertising promotion was tested to see if it would bring more customers to purchase a specific product priced at $10. Since it costs the company 0.15 to send out each promotion, it would be best to limit that promotion only to those that are most receptive to the promotion.
The data for this exercise consists of about 120,000 data points split in a 2:1 ratio among training and test files. It looks like this:
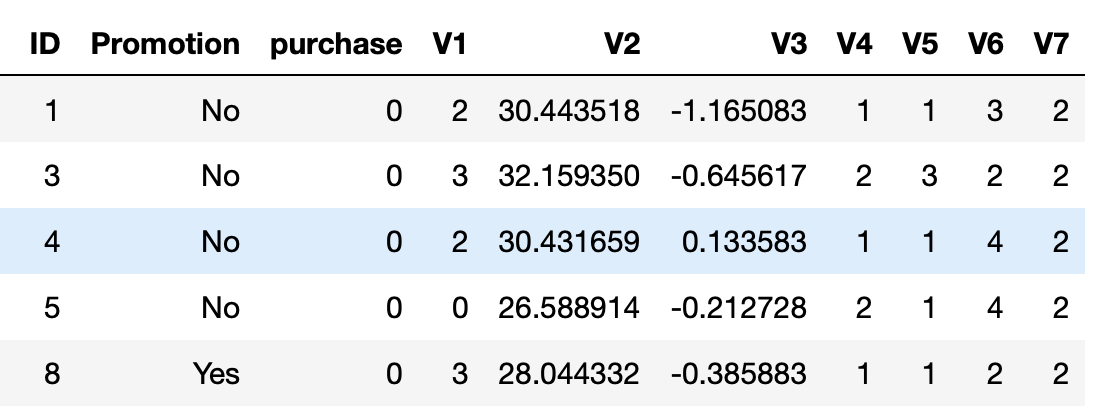
Each data point includes one column indicating whether or not an individual was sent a promotion for the product, and one column indicating whether or not that individual eventually purchased that product. Each individual also has seven additional features associated with them, which are provided abstractly as V1-V7.
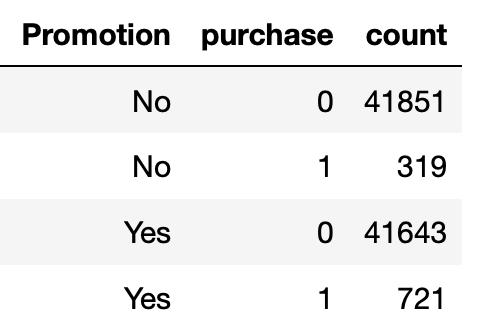
Based on whether a customer received an ad, we can divide the customers into control group (didn't receive an ad) and experiment group (received an ad). In training data, each group has about 42k+ data points and the purchase rates are 0.76% and 1.7% for control and experiment groups. Thus we can expect that one difficult task in this project is to handle data imbalance.
Out goal is to maximize the following metrics:
-
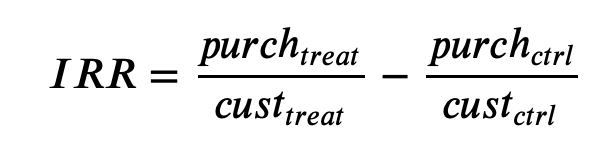
Incremental Response Rate (IRR) IRR depicts how many more customers purchased the product with the promotion, as compared to if they didn't receive the promotion. Mathematically, it's the ratio of the number of purchasers in the promotion group to the total number of customers in the purchasers group (treatment) minus the ratio of the number of purchasers in the non-promotional group to the total number of customers in the non-promotional group (control).
-
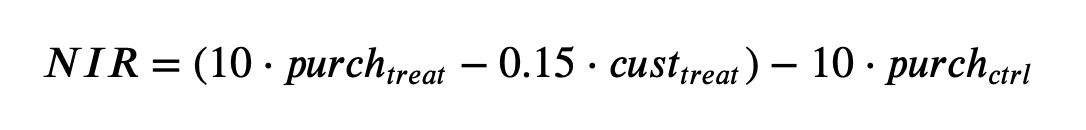
Net Incremental Revenue (NIR) NIR depicts how much is made (or lost) by sending out the promotion. Mathematically, this is 10 times the total number of purchasers that received the promotion minus 0.15 times the number of promotions sent out, minus 10 times the number of purchasers who were not given the promotion.
The testing function to evaluate the strategy is provided in the repo.
My strategy
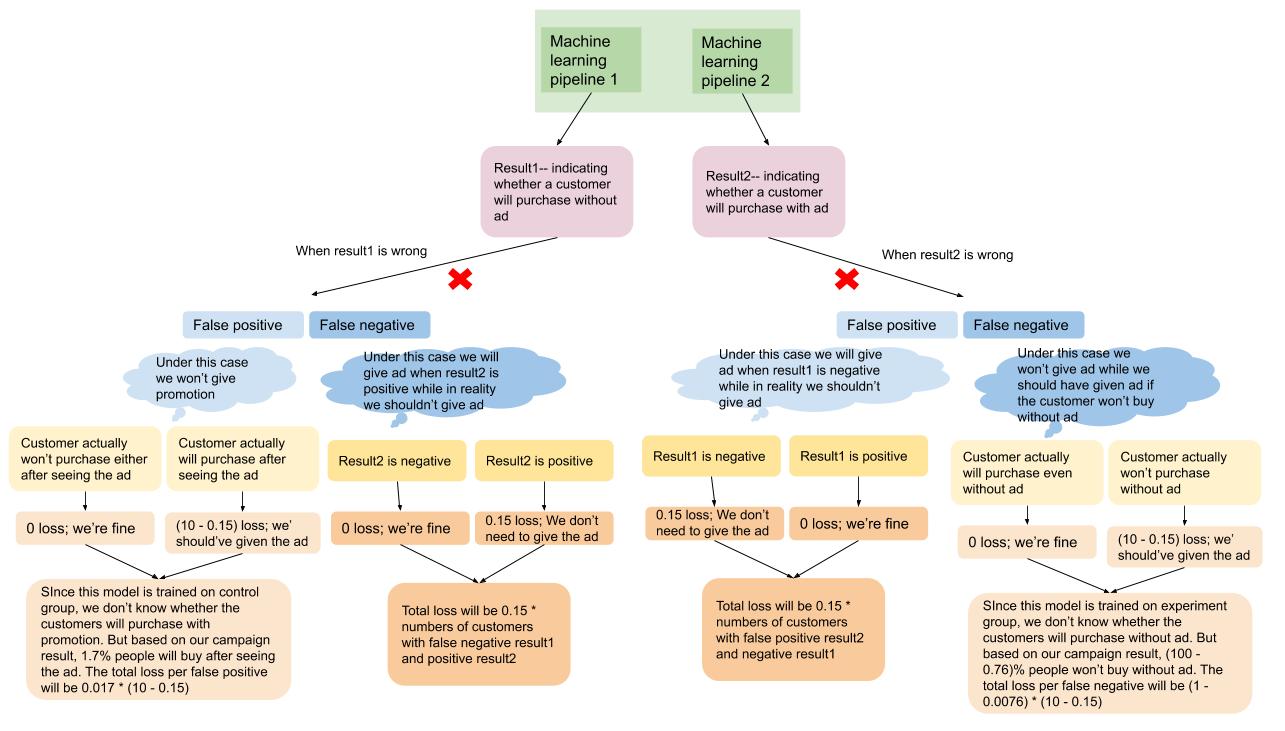
Our metrics IRR and NIR, all emphasize the idea that we will not only look for increasing the conversions, but also optimizing the ad cost. A very important strategy is to avoid sending ads to customers who are likely to buy even without seeing the ad and customers who are not likely to buy even when they see the ad. It's ideal to send ads to customers who might not feel interested before they see the ad, but have high chances to convert after they see the ad.
We will train 2 classifiers to predict whether a customer will buy the product --- one on control group (customers who didn't receive the promotion) and the other one on experiemnt group (customers who received the promotion). The 2 classifiers share the same structure and hyper parameters. The first classifier indicates whether a customer will purchase without ad and the second indicates whether a customer will purchase with ad. We will give promotion to customers who won't purchase without ad but will purchase when they see the ad.
The workflow will be like this
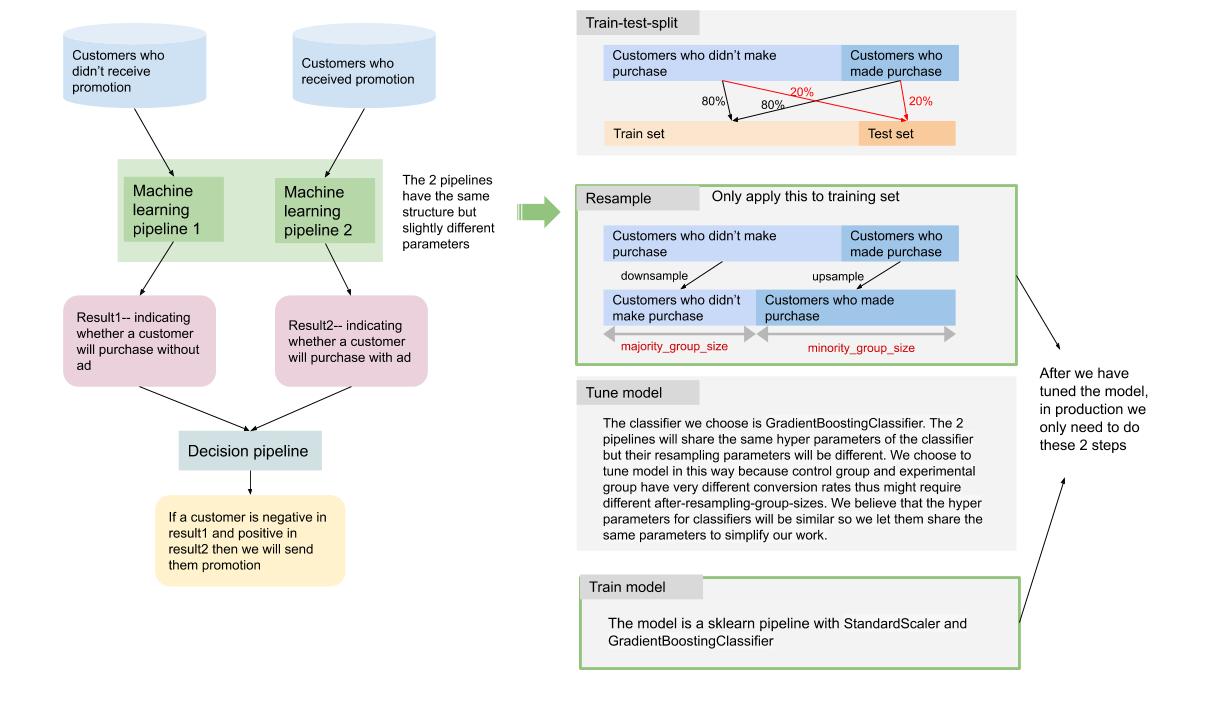
To handle data imbalance, we upsample the purchase group and downsample the non-purchase group seperately for control and experiment group --- the sizes of the resampled groups are tunable. Also, when we split the training data to train set and validation set (usually known as train_test_split), we did a stratified sampling to avoid the senario where there's no positive records in validation set and to make sure that the validation set is close to a real world testing data.
When tuning the model, we focused mostly on the loss from errors rather than gainings from giving the ads to the right people. It actually worked quite well in the end. More details can be found in the docstring of the function evaluate. The reason why we didn't consider true positives here to "reward" the model is that when we trained the models, we greatly balanced the data --- we greatly upsampled the purchase group and only sample a little (no more than 10%) from non-purchase group , so we can expect that recall is usually higher than precision. In other words, our model might have done its best to recognize the customers who will make purchases but it can be over optimistic. We want to correct that since giving promotion ads to too many people can greatly increase the cost of the campaign.
You can find the loss function evaluate in the repo. Because in real world we can't test a person whether they will purchase with ad or without ad at the same time, our loss function is an approximate to a "real world loss". You can find the logic below:
Parameters for tuning:
control_minority_group_size: group size of the purchase control group after resamplingcontrol_majority_group_size: group size of the non-purchase control group after resamplingexpr_minority_group_size: group size of the purchase experiment group after resamplingexpr_majority_group_size: group size of the non-purchase experiment group after resamplinglearning_rate: parameter for GradientBoostingClassifiermax_depth: parameter for GradientBoostingClassifiermin_samples_split: parameter for GradientBoostingClassifier
When doing grid search, for each parameter combination, we run generate_promotion_customer_list 5 times and then calculate average loss. This is an approximate methods to 5 folds cross validation. Rather than spliting the data to 5 folds ahead and use one fold as validation set at one time, we randomly split data each time we run the model. This might be the laziness of the author :) and can be improved by 5 folds validation in the future.
Our grid search algorithm is kind of written from scratch because the resampling step only applies to training set, not the validation or test set so we can't directly include it in Pipeline object and use sklearn GridSearchCV on the Pipeline. But there might be a way --- given the time I haven't had a chance to dig into possible solutions. I'll leave it to when I refactor this repo later.
Result
Udacity provided a benchmark result for us to compare:
irr: 0.0188nir: 189.45
Our irr is close to the Udacity one and our nir is much higher ---- thanks to our strict loss function!
Remember that there are a lot of resamplings (expecially down-samplings) and other processes that will generate different result under different random_state. We will get different result every time we run our algorithm! So I ran the whole process for 10 times and plotted the distributions of irr and nir:
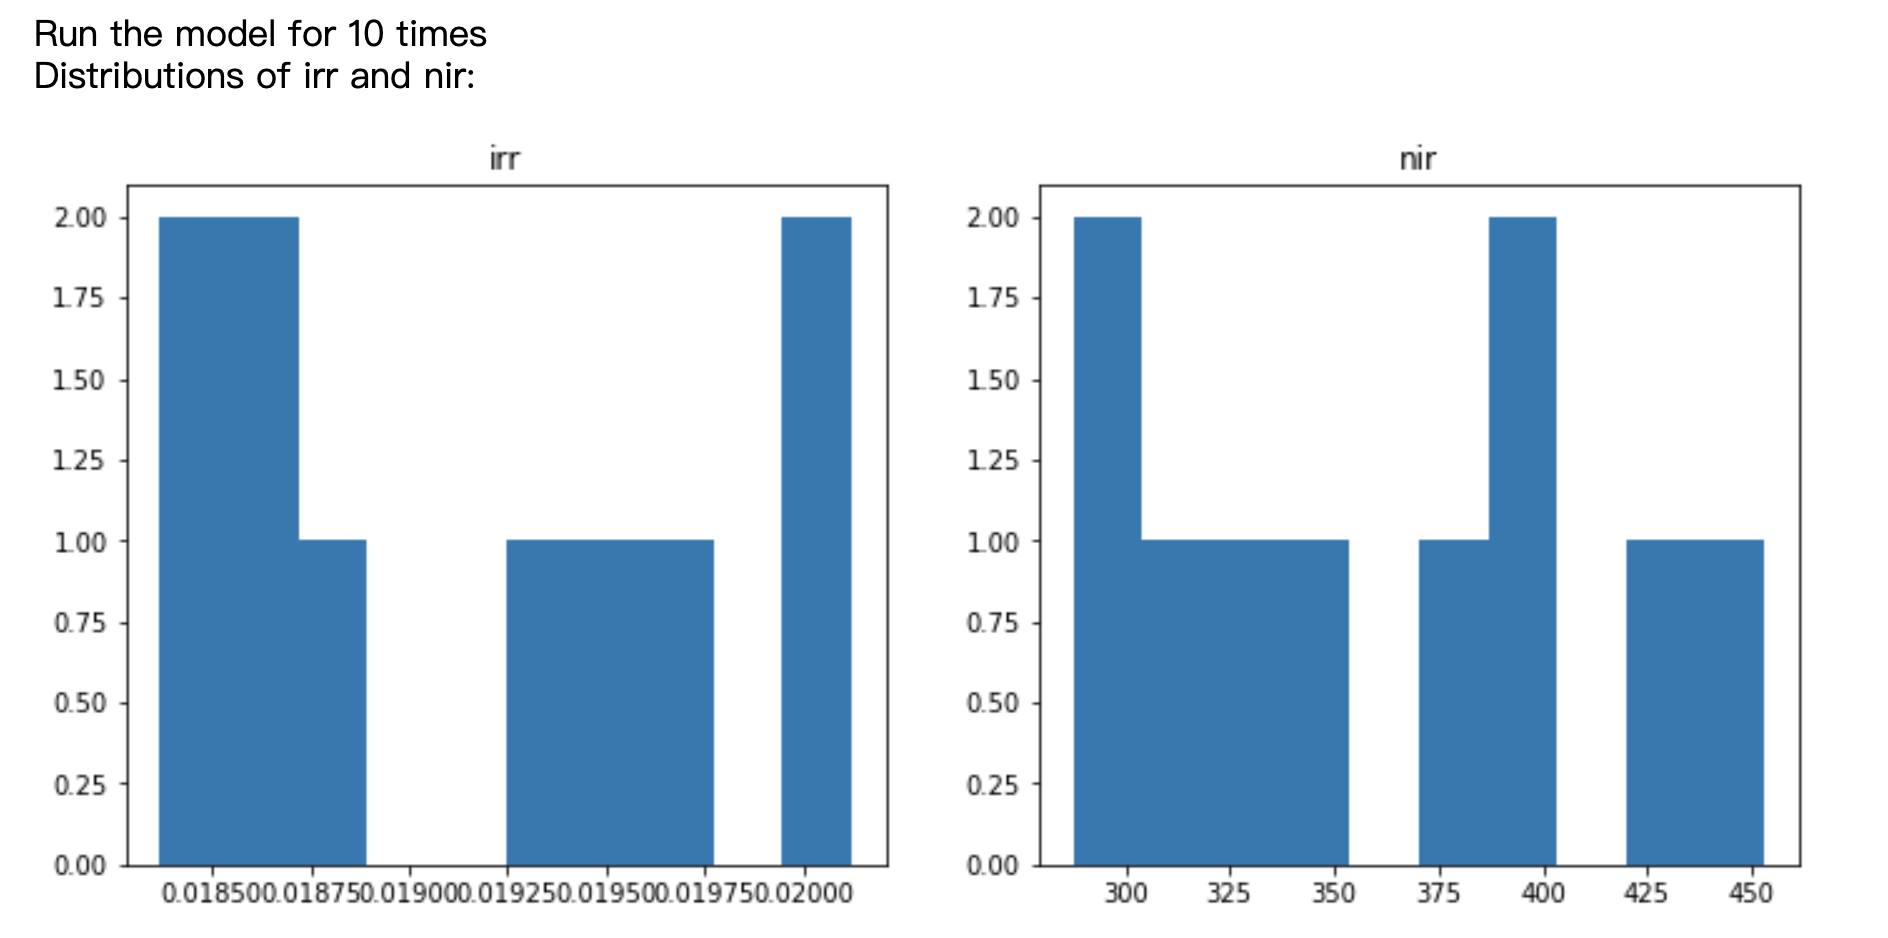
Our irr is between 0.018 and 0.02, nir is between 300 and 450!
Future improvement
A lot of processes in this project were kind of written from scratch. But there might be open source packages that can make my work easier (e.g. imbalance-learn). I'll do more research and change the modeling process to a sklearn Estimator object that can be tuned by GridSearchCV. This will be a seperate project later :)