This repo contains XML files for most of the colour maps on the SciVisColor Website. Clone or download the repo, add to your Matlab path, and start making great visualizations! The above linked website has great tips to help you get started. Feel free to download more of their colourmaps into the cmaps/ folder. Check out the examples directory to get started.
The available colour maps are shown here:
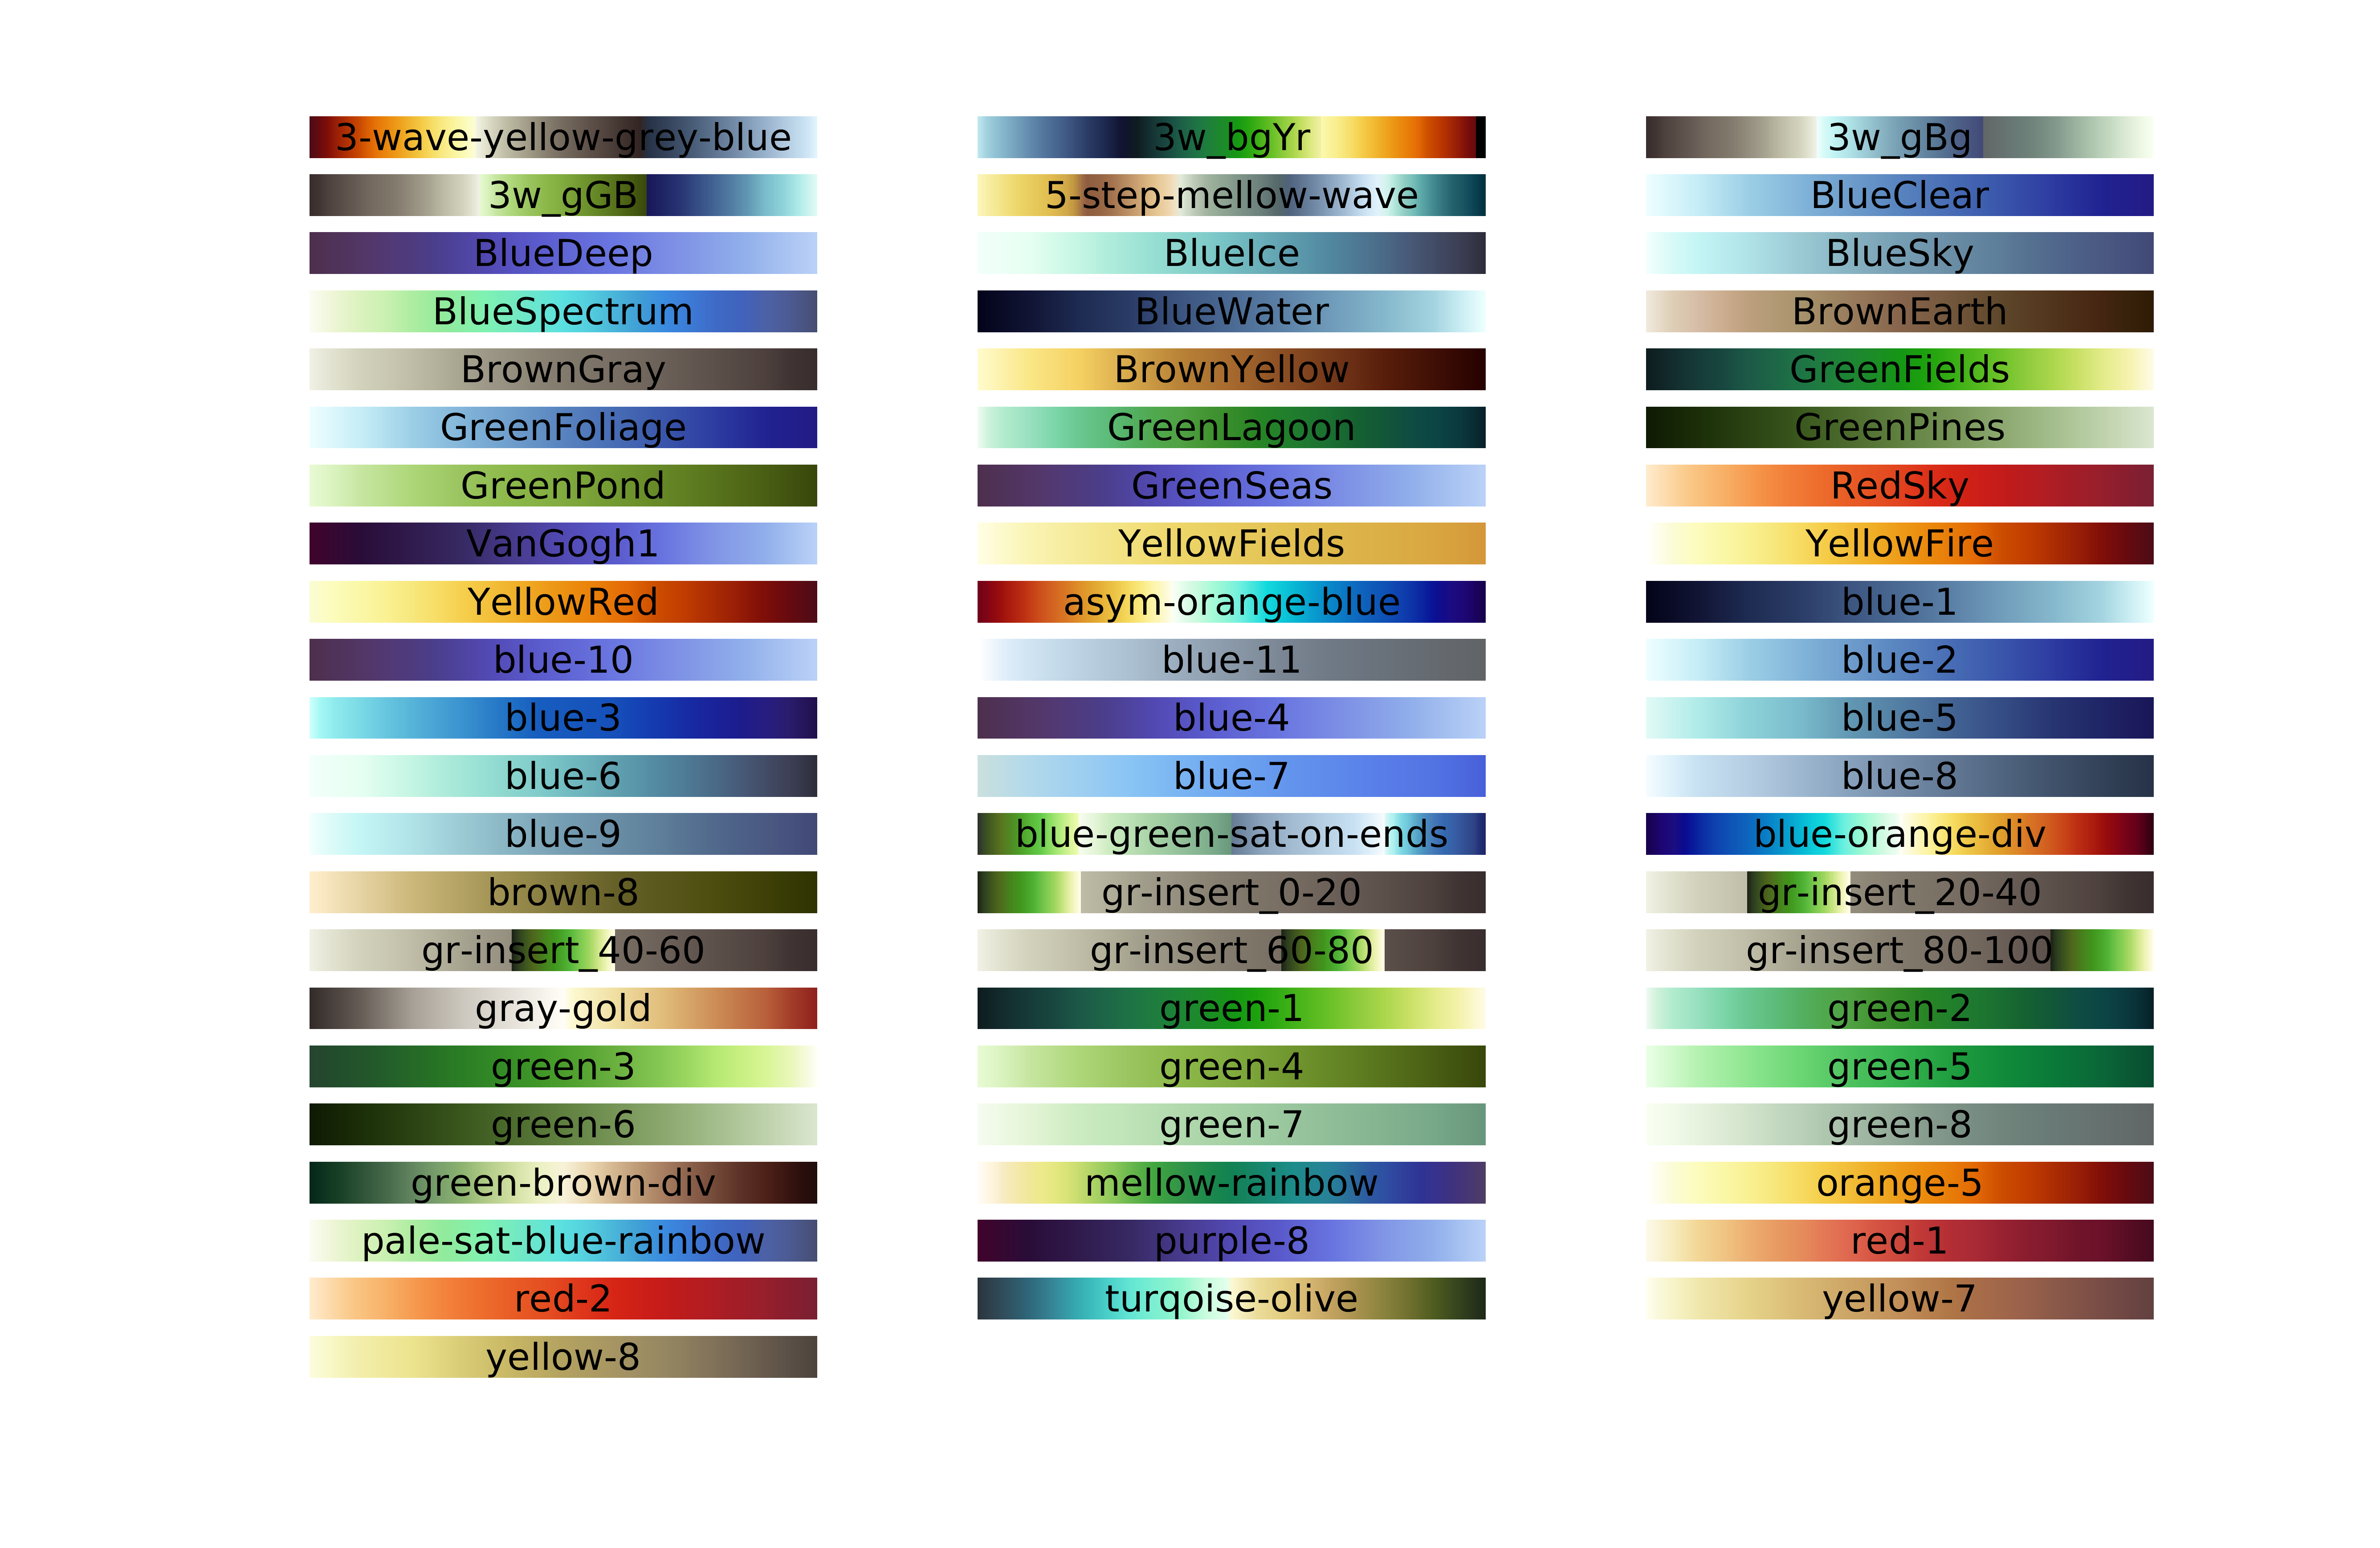
The Matlab functions support three usage patterns:
palettesplots all available colourmaps (e.g. figure above)palette_cmap=palettes(cmap_name)returns a 128-by-3 array suitable to use as a matlab colourmap, e.g.colormap(palette_cmap).palette_cmap=palettes(cmap_name,N)returns an N-by-3 array as in the previous usage case.
The Python module has two functions and simply wraps the script cm_xml_to_matplotlib function provided by SciVisColor. Import the module as
from palettes.code import palettesThe two functions are:
palette_cmap=palettes.get_cmap(cmap_name)returns a matplotlib linear segmented colormap to pass on to matplotlib functions, e.g.plt.pcolormesh(xx,yy,Z,cmap=palette_cmap).palettes.show()plots all available colourmaps
You can also execute the file palettes.py directly (python palettes.py) to create the figure showing available colourmaps
The following example shows the albedo on Kaskawulsh Glacier using an asymmetrical wave colourmap. This figure is created by the test_cm.m script.
