pyfilter is a package designed for joint parameter and state inference in state space models using particle filters and particle filter based inference algorithms. It's borne out of my layman's interest in Sequential Monte Carlo methods, and a continuation of my Master's thesis.
Some features include:
- Particle filters in the form of SISR and APF together with different proposal distributions.
- Both online and offline inference algorithms such as
- pytorch backend enables GPU accelerated inference - what took hours on a CPU now takes minutes (or even seconds).
Follow the below instructions in order to get started with pyfilter.
Start by installing pytorch.
To install pyfilter just copy the below command into your favourite terminal
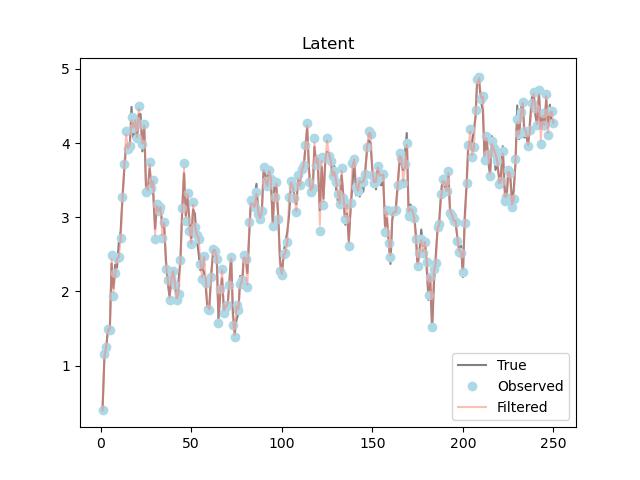
pip install git+https://github.com/tingiskhan/pyfilterAll examples are located here, but you'll find a short one below in which we define a sine diffusion process which we observe with some noise, and then back out using the APF together with the "optimal proposal" distribution
from stochproc import timeseries as ts
import torch
from pyro.distributions import Normal
import matplotlib.pyplot as plt
from pyfilter.filters.particle import APF, proposals
from math import sqrt


def f(x, gamma, sigma):
    return torch.sin(x.value - gamma), sigma


def build_observation(x, a, s):
    return Normal(loc=a * x.value, scale=s)


def initial_kernel(gamma, sigma):
    return Normal(torch.zeros_like(gamma), torch.ones_like(gamma))


dt = 0.1

gamma = 0.0
sigma = 1.0

inc_dist = Normal(loc=0.0, scale=sqrt(dt))
sine_diffusion = ts.AffineEulerMaruyama(f, (gamma, sigma), inc_dist, initial_kernel=initial_kernel, dt=dt)

a = 1.0
s = 0.1

ssm = ts.StateSpaceModel(sine_diffusion, build_observation, (a, s))

sample_result = ssm.sample_states(250)
x, y = sample_result.get_paths()

fig, ax = plt.subplots()

ax.set_title("Latent")
ax.plot(sample_result.time_indexes, x, label="True", color="gray")
ax.plot(sample_result.time_indexes, y, marker="o", linestyle="None", label="Observed", color="lightblue")

filt = APF(ssm, 250, proposal=proposals.LinearGaussianObservations(0))
result = filt.batch_filter(y)

ax.plot(sample_result.time_indexes, result.filter_means.numpy()[1:], label="Filtered", color="salmon", alpha=0.5)
ax.legend()Contributions are always welcome! Simply
- Fork the project.
- Create your feature branch (I try to follow Microsoft's naming).
- Push the branch to origin.
- Open a pull request.
Distributed under the MIT License, see LICENSE for more information.
Contact details are located under setup.py.
