Nathan Chaney May 20, 2021
The rweightlifting package is designed to assist weightlifters and their coaches with creating programs and monitoring trainees’ progress. The package contains functions for calculating common variables used in barbell training, such as 1-rep max, N-rep max, training maxes, tonnage, etc. The package includes an interactive shiny dashboard that allows weightlifters to visualize progress and compare common training programs against past results.
This package is designed for interactive use via the dashboard in the
shiny directory. You’ll need to point the data source for both
weightlifting logs and body weight logs to the right directories to use
the shiny app.
The load_csv_data function reads weightlifting logs. The expected
format is one CSV file for each weightlifting program. The
load_csv_data reads all CSV files in the specified directory. The
function expects an input format that includes a header row, as follows:
date, exercise, equipment, variant, set1weight, set1reps, set2weight, set2reps, ..., setNweight, setNreps
weightlifting.log <- load_csv_data(datadir = my.datadir)The function creates a data table with one set per row, as follows:
| program | date | exercise | equipment | variant | set | reps | weight |
|---|---|---|---|---|---|---|---|
| 2021-05_531 | 2021-05-19 | deadlift | barbell | conventional | 5 | 2 | 455 |
| 2021-05_531 | 2021-05-19 | squat | barbell | low bar | 1 | 5 | 320 |
| 2021-05_531 | 2021-05-19 | squat | barbell | low bar | 2 | 5 | 320 |
| 2021-05_531 | 2021-05-19 | squat | barbell | low bar | 3 | 5 | 320 |
| 2021-05_531 | 2021-05-19 | squat | barbell | low bar | 4 | 5 | 320 |
| 2021-05_531 | 2021-05-19 | squat | barbell | low bar | 5 | 5 | 320 |
The dashboard provided in the shiny directory contains many available
visualizations for common metrics used in weightlifting. A few examples
are provided below.
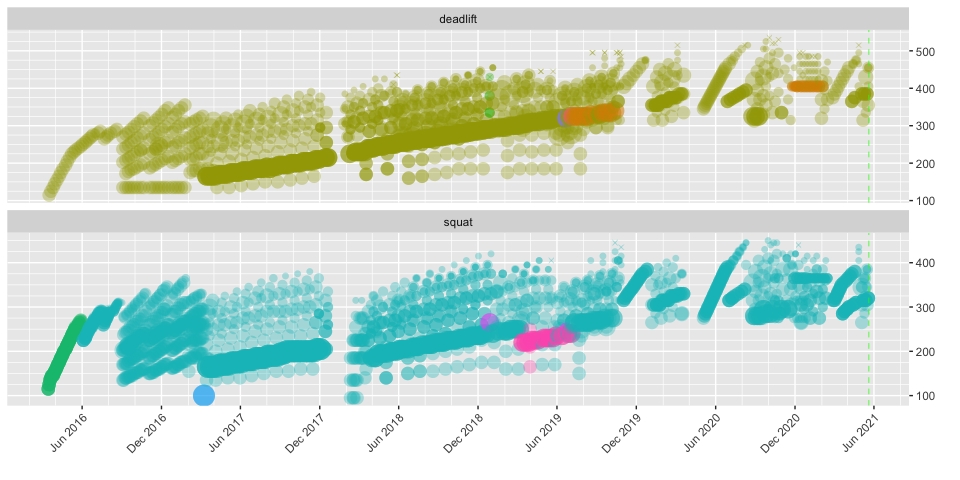
This view shows each set performed; it is a way to show progress (and consistency) at a glance, as follows:
In this view, you can see that a linear progression program was followed at the beginning, followed by more complex programming over time. You can also see a gaps around January 2018 (when I tore my calf playing tennis) and April 2020 (when gyms were closed due to the COVID-19 pandemic). The colors indicate different exercise, equipment, and exercise variants. Missed attempts (i.e., reps = 0) are denoted with an X shape.
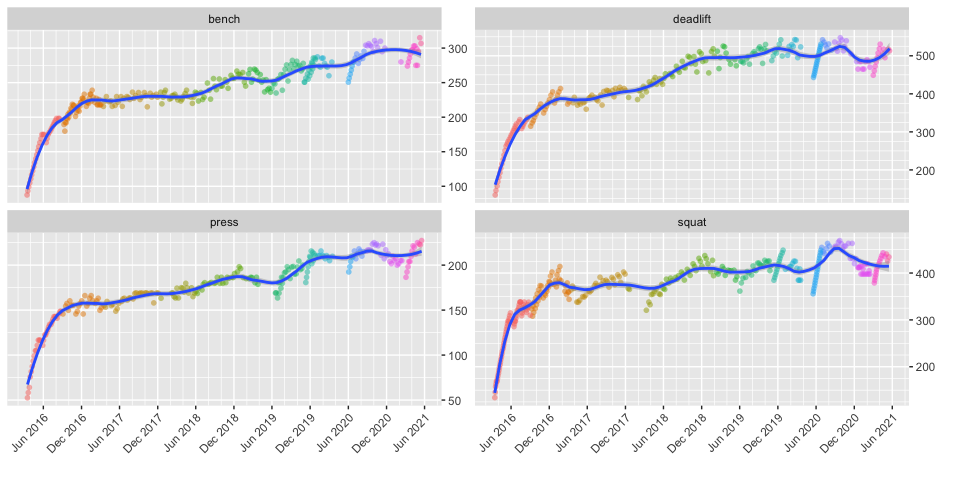
The strength view uses a caculated one-rep max to show progress in strength over time. It is a way to compare absolute strength across different set/rep schemes.
Broadly speaking, this view shows a lifter with increasing absolute strength over time. Bubbles of different colors denote different programs.
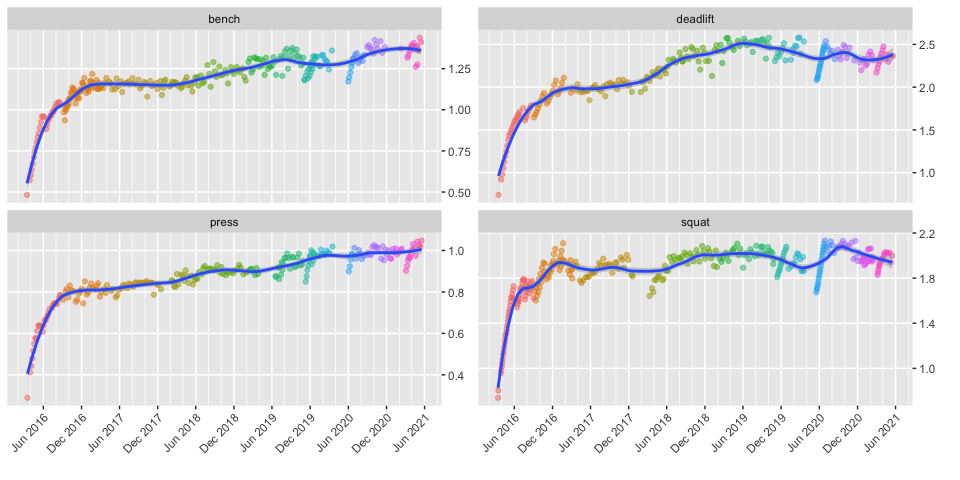
A similar view in the shiny app shows relative strength, which is
obtained by dividing a calculated 1-RM by the lifter’s body weight. This
view is useful for comparing a lifter’s performance to strength
standards, which
commonly reference multiples of body weight (e.g., 1x, 2x, 2.5x). It is
also useful for monitoring performance across bulking or cutting cycles.
Note that the curves for absolute and relative strength are similar but not identical. As one example, the estimated 1RM for the deadlift has hovered around 500 - 525 since December 2018. However, the absolute strength has declined from a high of around 2.5x in June 2019 to around 2.3-2.4x as of the time of writing (this is attributable primarily to the, ahem, COVID nineteen pounds). I generally use the absolute strength view during bulking cycles (for comparison against all-time strength) and the relative strength view during cutting cycles (to make sure I’m not losing ground).
There are many other views shown in the dashboard located in the shiny
directory. These include:
- Personal Records (PRs) by weight, program, tonnage, reps, and reps across
- Tonnage broken down by exercise, week, and day
- Ranges for weight and tonnage broken down by program
- Calendars that show lift days, weight PRs, tonnage PRs, and rep PRs
- A competition programming view to assist in selecting lifts for weightlifting competitions
Weightlifters change programming periodically in order to accommodate different goals, such as to increase the amount of work performed, to change set/rep ranges, or to start fresh after a layoff due to illness. The rweightlifting package contains functions designed to assist the coach or lifter in preparing a new program. The starting position for the new program is tied to a specific percentage of the lifter’s previous one-rep maximum, which is called the training max. For instance, a typical starting point after a week’s vacation might set the training max at 90% of the lifter’s calculated 1RM over the last month. The functions contain sensible defaults; the dashboard permits a user to adjust pertinent variables in order to get the desired level of difficulty.
For the lifter identified above, the package provides the following of a new program based on Jim Wendler’s basic 3-week 5-3-1 program (this is the first week only):
| cycle | day | date | exercise | equipment | variant | set | reps | percentage | training_max | weight | max.reps |
|---|---|---|---|---|---|---|---|---|---|---|---|
| 1 | 1 | 2021-05-21 | bench | barbell | flat | 1 | 5 | 0.65 | 267.5 | 175 | 11 |
| 1 | 1 | 2021-05-21 | bench | barbell | flat | 2 | 5 | 0.75 | 267.5 | 200 | 11 |
| 1 | 1 | 2021-05-21 | bench | barbell | flat | 3 | 5 | 0.85 | 267.5 | 225 | 11 |
| 1 | 2 | 2021-05-22 | squat | barbell | low bar | 1 | 5 | 0.65 | 392.0 | 255 | 8 |
| 1 | 2 | 2021-05-22 | squat | barbell | low bar | 2 | 5 | 0.75 | 392.0 | 295 | 8 |
| 1 | 2 | 2021-05-22 | squat | barbell | low bar | 3 | 5 | 0.85 | 392.0 | 335 | 7 |
| 1 | 4 | 2021-05-24 | press | barbell | overhead | 1 | 5 | 0.65 | 199.9 | 130 | 9 |
| 1 | 4 | 2021-05-24 | press | barbell | overhead | 2 | 5 | 0.75 | 199.9 | 150 | 8 |
| 1 | 4 | 2021-05-24 | press | barbell | overhead | 3 | 5 | 0.85 | 199.9 | 170 | 8 |
| 1 | 5 | 2021-05-25 | deadlift | barbell | conventional | 1 | 5 | 0.65 | 460.9 | 300 | 8 |
| 1 | 5 | 2021-05-25 | deadlift | barbell | conventional | 2 | 5 | 0.75 | 460.9 | 345 | 8 |
| 1 | 5 | 2021-05-25 | deadlift | barbell | conventional | 3 | 5 | 0.85 | 460.9 | 390 | 10 |
For convenience, we can also add the maximum number of reps at each specific weight the trainee is supposed to lift. This assists with giving the lifter a “rep PR” to shoot for each time in the gym, which is helpful for programs that recommend an AMRAP (as many reps as possible) scheme for work sets such as Wender 5-3-1.
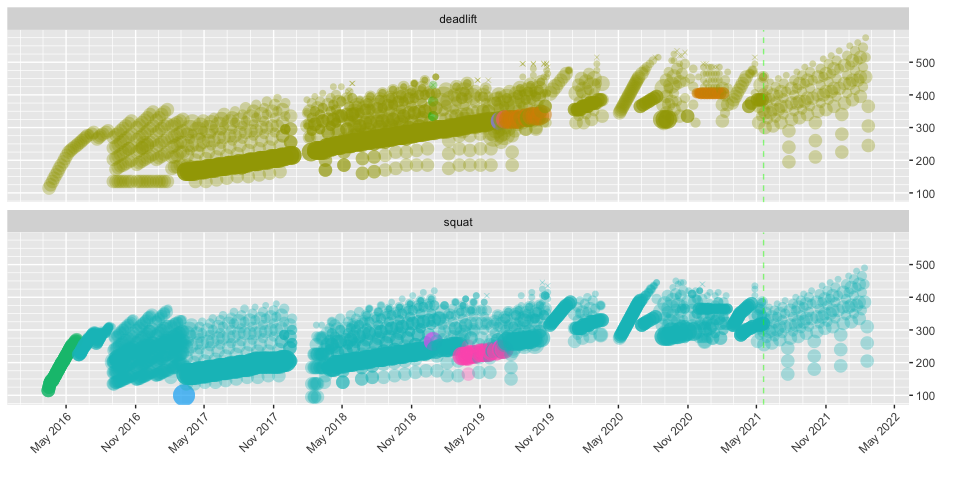
This information can be displayed alongside historical training information to provide a visual representation of a new program’s potential for gains over time:
The vertical green line represents today (currently 20 May 2021); projected performance resulting from compliance with the new program is plotted to the right of the green line. Another feature displayed here is the ability to program deload weeks every so often – in this case after every 3 cycles. Note that the projected work doesn’t necessarily include accessory or supplemental work that may appear in historical data.
The supported programs include:
#> [1] "Novice Linear Progression"
#> [2] "4-Day Volume-Intensity Split"
#> [3] "Madcow 5x5"
#> [4] "Wendler 5-3-1"
#> [5] "Wendler 5-3-1 Pyramid"
#> [6] "Base 5-3-1, Bench 8-6-3"
#> [7] "Lower 5-3-1, Upper 8-6-3, Last Set First"
#> [8] "Lower 5-3-1 with 1 Backoff, Upper 8-6-3 Pyramid"
It is desired that future versions of the package’s dashboard will permit creation of custom programs on an exercise-by-exercise basis.


