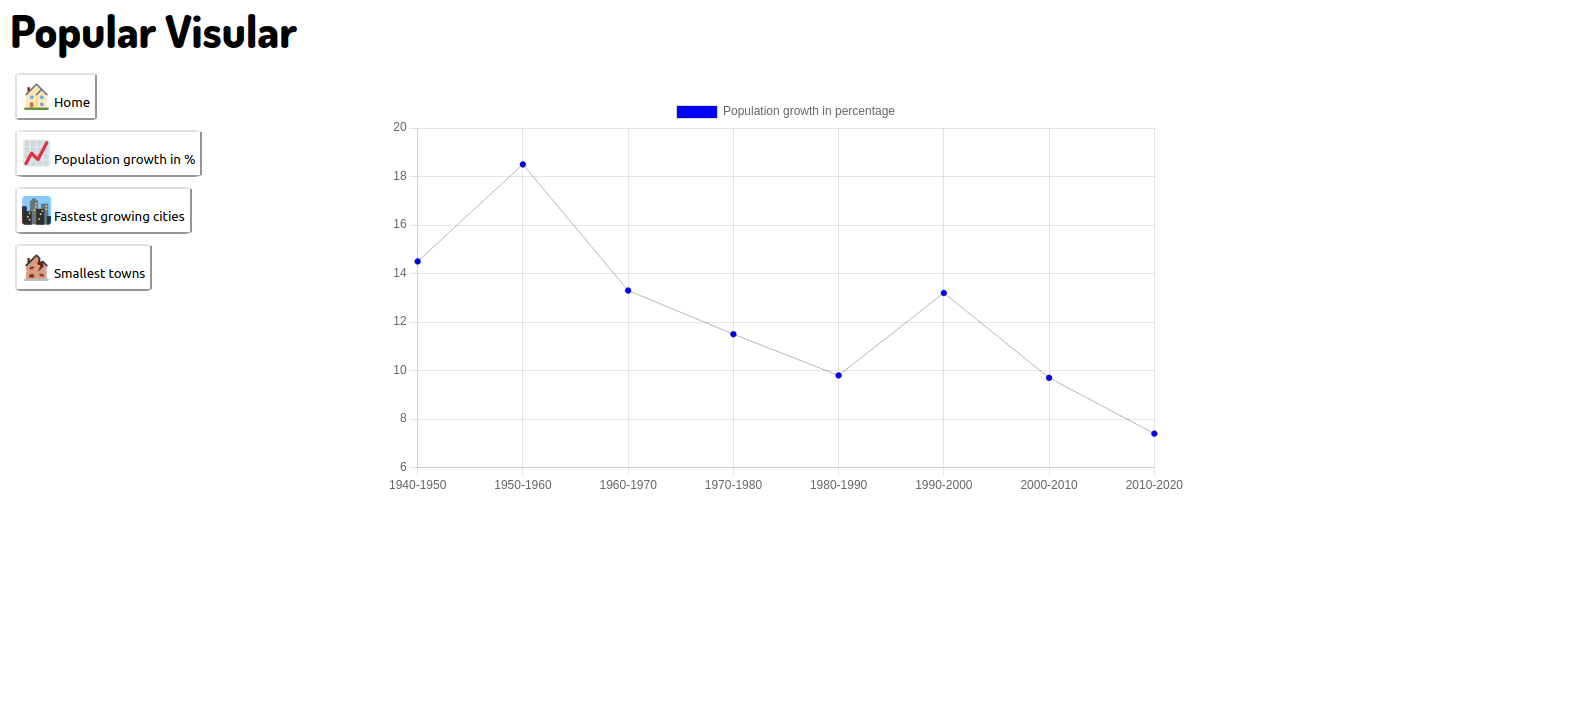
Data science application showcasing population data inside the USA
- Growth data in the span of 50 years
- Fastest growing cities in the USA
- Least populated towns in the USA
Fastest growing cities in the USA
- Clone repo into desired directory
git clone https://github.com/Toughee/PopuliVisular.gitorgh repo clone Toughee/PopuliVisular - Run
npm installin your terminal to install all app node modules and dependencies - Run
yarn startin your terminal to run app on http://localhost:3000/
- React Testing library
- Jest
- Cypress
- TravisCI
- CircleCI
- Cypress
- Adding more sources for information
- New option for more demographic information
- New data points (births by gender, average salary, changing demographics, average income)
- Adding more data components inside app
- Add video/gif walkthrough of app use
- Adding all information to a backend API instead of having all data inserted into inline JS code
- Include CircleCI and Travis-CI inside project

