In this Code Pattern, we will use German Credit data to train, create, and deploy a machine learning model using Watson Machine Learning. We will create a data mart for this model with Watson OpenScale and configure OpenScale to monitor that deployment, and inject seven days' worth of historical records and measurements for viewing in the OpenScale Insights dashboard.
When the reader has completed this Code Pattern, they will understand how to:
- Create and deploy a machine learning model using the Watson Machine Learning service
- Setup Watson OpenScale Data Mart
- Bind Watson Machine Learning to the Watson OpenScale Data Mart
- Add subscriptions to the Data Mart
- Enable payload logging and performance monitor for subscribed assets
- Enable Quality (Accuracy) monitor
- Enable Fairness monitor
- Score the German credit model using the Watson Machine Learning
- Insert historic payloads, fairness metrics, and quality metrics into the Data Mart
- Use Data Mart to access tables data via subscription

- The developer creates a Jupyter Notebook on Watson Studio.
- The Jupyter Notebook is connected to a PostgreSQL database, which is used to store Watson OpenScale data.
- The notebook is connected to Watson Machine Learning and a model is trained and deployed.
- Watson OpenScale is used by the notebook to log payload and monitor performance, quality, and fairness.

- An IBM Cloud Account.
- IBM Cloud CLI
- An account on IBM Watson Studio.
- Clone the repository
- Use free internal DB or Create a Databases for PostgreSQL DB
- Create a Watson OpenScale service
- Create a Watson Machine Learning instance
- Create a notebook in IBM Watson Studio
- Run the notebook in IBM Watson Studio
- Setup OpenScale to utilize the dashboard
git clone https://github.com/IBM/monitor-wml-model-with-watson-openscale
cd monitor-wml-model-with-watson-openscaleIf you wish, you can use the free internal Database with Watson OpenScale. To do this, make sure that the cell for KEEP_MY_INTERNAL_POSTGRES = True remains unchanged.
Note: Services created must be in the same region, and space, as your Watson Studio service.
- Using the IBM Cloud Dashboard catalog, search for PostgreSQL and choose the
Databases for Postgresservice. - Wait a couple of minutes for the database to be provisioned.
- Click on the
Service Credentialstab on the left and then clickNew credential +to create the service credentials. Copy them or leave the tab open to use later in the notebook. - Make sure that the cell in the notebook that has:
KEEP_MY_INTERNAL_POSTGRES = Trueis changed to:
KEEP_MY_INTERNAL_POSTGRES = FalseNOTE: At this time (3/27/19) you must use an instance of Watson OpenScale deployed in the
Dallasregion. This is currently the only region that sends events about scoring requests to the message hub, which is read by OpenScale to populate the payload logging table.
- Using the IBM Cloud Dashboard create a Watson OpenScale service.
- You will get the Watson OpenScale instance GUID when you run the notebook using the IBM Cloud CLI
-
Under the
Settingstab, scroll down toAssociated services, click+ Add serviceand chooseWatson:
-
Search for
Machine Learning, Verify this service is being created in the same space as the app in Step 1, and clickCreate.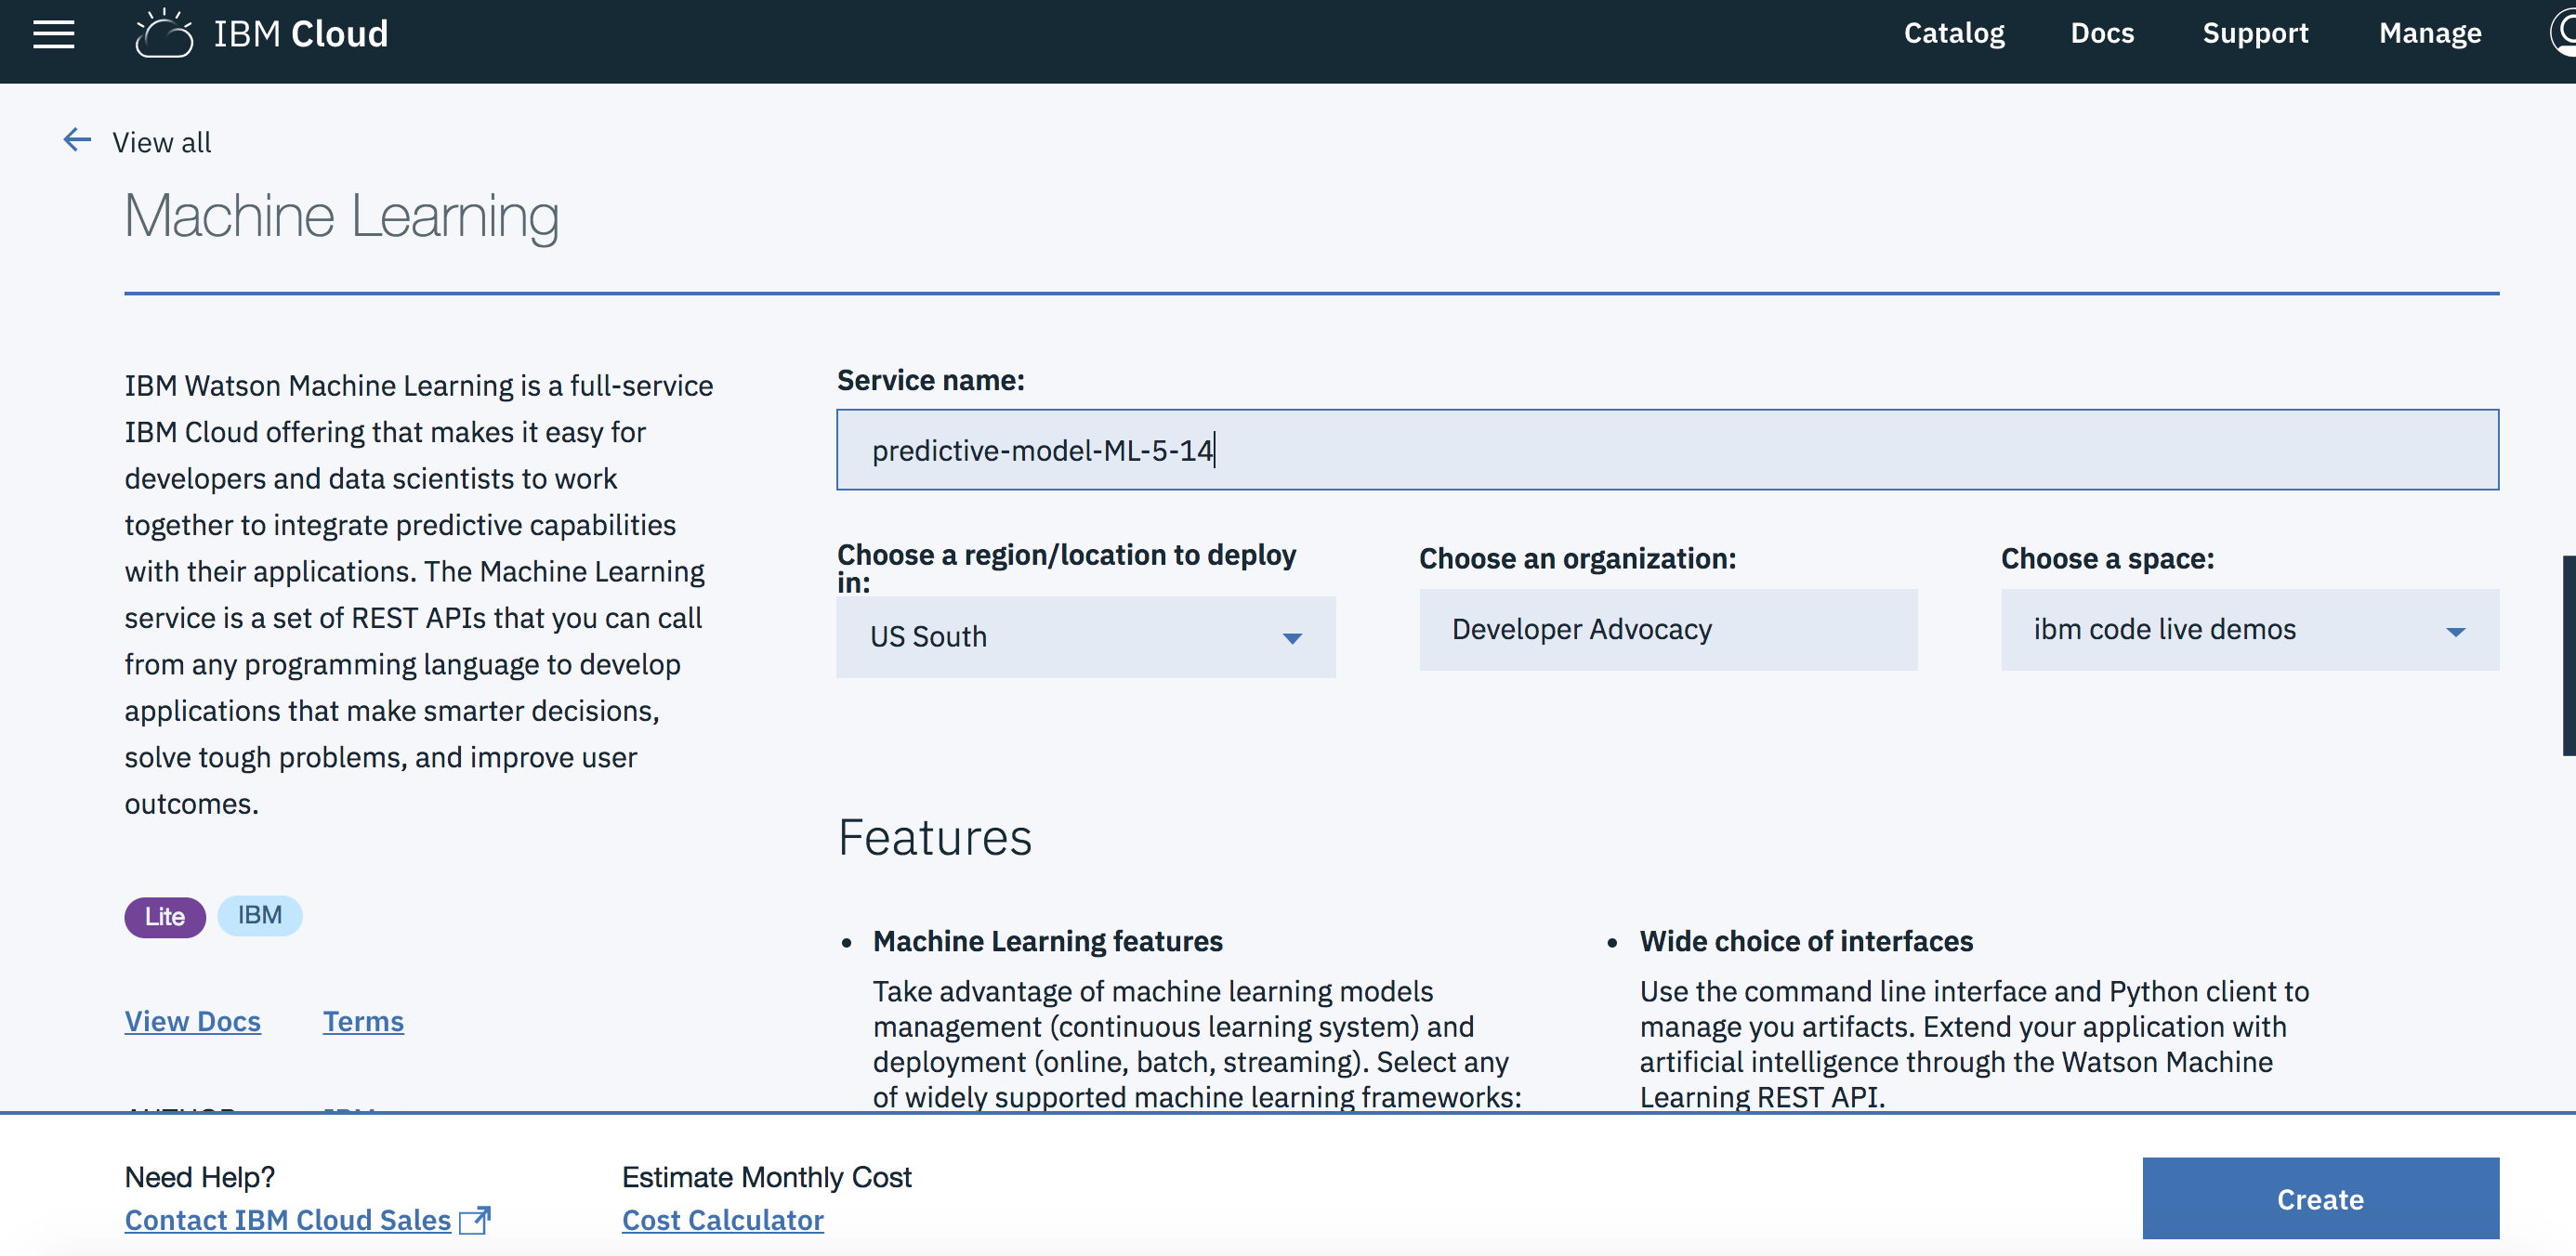
-
Alternately, you can choose an existing Machine Learning instance and click on
Select.
-
The Watson Machine Learning service is now listed as one of your
Associated Services. -
In a different browser tab go to https://cloud.ibm.com/ and log in to the Dashboard.
-
Click on your Watson Machine Learning instance under
Services, click onService credentialsand then onView credentialsto see the credentials.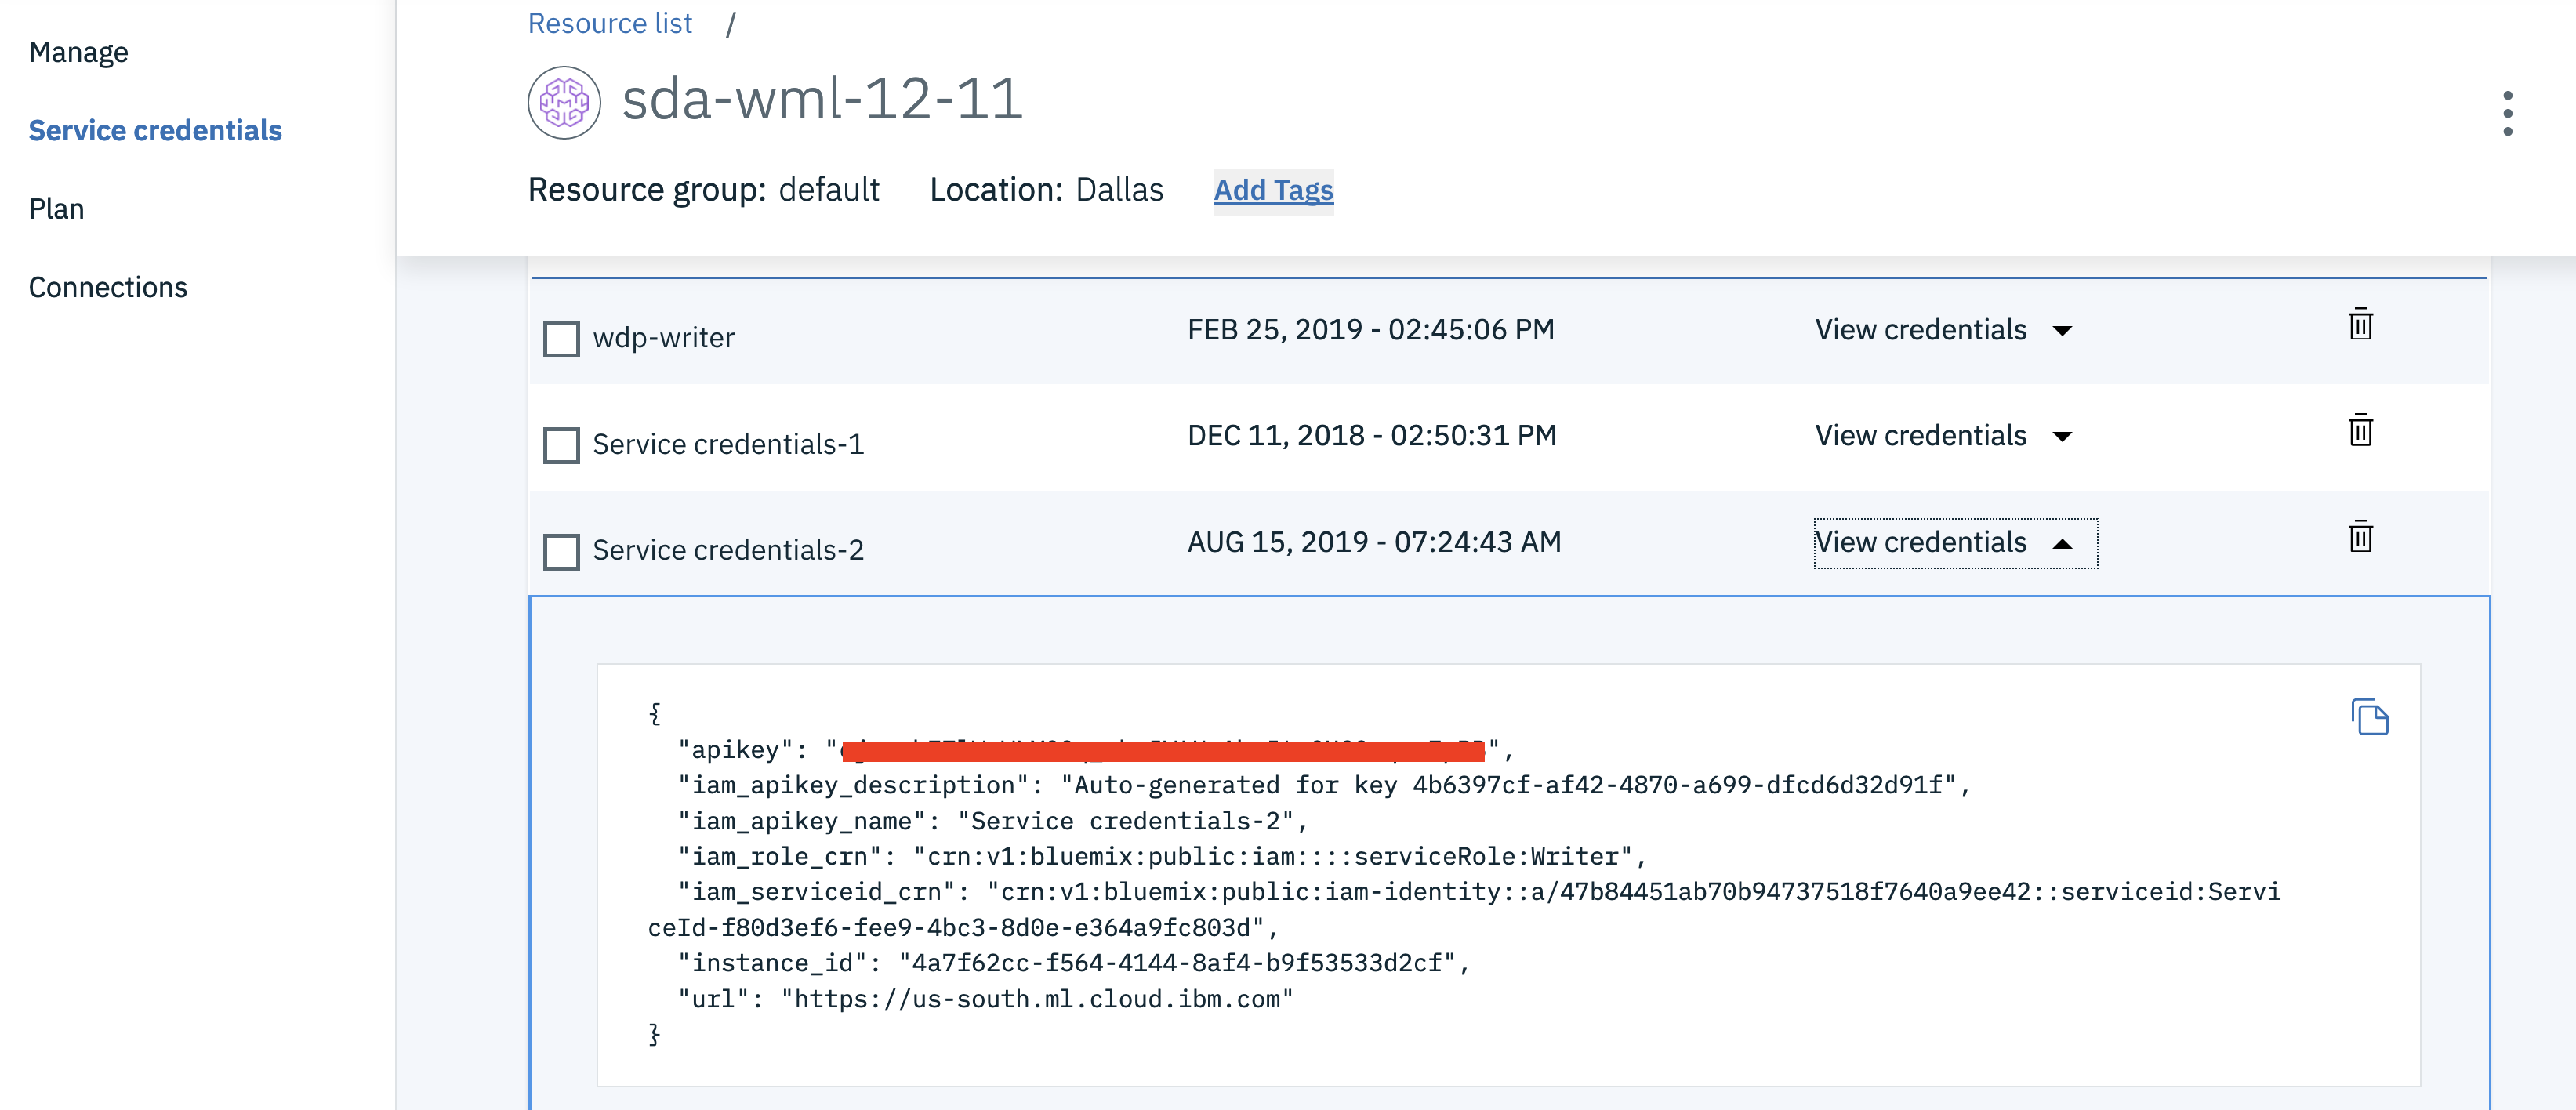
-
Save the credentials in a file. You will use them inside the notebook.

- In Watson Studio, click
New Project +under Projects or, at the top of the page click+ Newand choose the tile forData Scienceand thenCreate Project. - In Watson Studio using the project you've created, click on
+ Add to projectand then choose theNotebooktile, OR in theAssetstab underNotebookschoose+ New notebookto create a notebook. - Select the
From URLtab. [1] - Enter a name for the notebook. [2]
- Optionally, enter a description for the notebook. [3]
- Under
Notebook URLprovide the following url: https://raw.githubusercontent.com/IBM/monitor-wml-model-with-watson-openscale/master/notebooks/OpenScale.ipynb [4] - For
Runtimeselect theDefault Python 3.6 Freeoption. [5] - Click the
Create notebookbutton. [6]

Follow the instructions for Provision services and configure credentials:
Your Cloud API key can be generated by going to the Users section of the Cloud console.
- From that page, click your name, scroll down to the API Keys section, and click Create an IBM Cloud API key.
- Give your key a name and click Create, then copy the created key and paste it below.
Alternately, from the IBM Cloud CLI :
ibmcloud login --sso
ibmcloud iam api-key-create 'my_key'- Get the Watson OpenScale GUID using the IBM Cloud CLI :
ibmcloud resource service-instance <Watson_OpenScale_instance_name>-
Enter the
AIOS_GUIDandCLOUD_API_KEYin the next cell for theAIOS_CREDENTIALS. -
Add the Watson Machine Learning credentials for the service that you created in the next cell as
WML_CREDENTIALS. -
Either use the internal Database, which requires No Changes or Add your
DB_CREDENTIALSafter reading the instructions preceeding that cell and change the cellKEEP_MY_INTERNAL_POSTGRES = Trueto becomeKEEP_MY_INTERNAL_POSTGRES = False. -
Move your cursor to each code cell and run the code in it. Read the comments for each cell to understand what the code is doing. Important when the code in a cell is still running, the label to the left changes to In [*]:. Do not continue to the next cell until the code is finished running.
Now that you have created a machine learning model, you can utilize the OpenScale dashboard to gather insights. Follow the steps to configure the OpenScale dashboard
- Go to the instance of Watson OpenScale that you created and click
Manageon the menu and thenLaunch Application. Choose theInsightstab to get an overview of your monitored deployments, Accuracy alerts, and Fairness alerts.

- Click on the tile for the
Spark German Risk Deploymentand you can see graphs forFairness,Accuracy, andPerformance (Avg. Requests/Minute). Click on a portion of the graph to bring up a detailed view. We'll describe the data we clicked on, yours will vary.

-
You can see from the image above that, at this time, our model is receiving 4.6 requests per minute, with an accuracy of 72%. We have 13% of our credit risk (and 87% of no risk) due the fact that this individual is age 18 to 25, and 28% credit risk (and 72% of no risk) due to the fact that this individual is female. This latter statistic id flagged as
bias. -
Now click
View details.

-
We can see that, for the
agecategory, 87% of 18 to 25 year olds receivedNo Riskcompared to 82% of 26 to 75 year olds. This is not flagged as biased. -
Now click on the tab marked
ageand change it tosex. We can see that only 71% of the females group received the outcome ofNo Riskas compared to 78% of the male group. This is flagged asBIAS. Now click onView Transactions.

- In the
Explain a transactionwindow, we can see the details as to which feature contributed specific amounts to the overall assesment ofRiskvs.No Risk, as well asMinimum changes for another outcomeandMinimum factors supporting this outcome.
