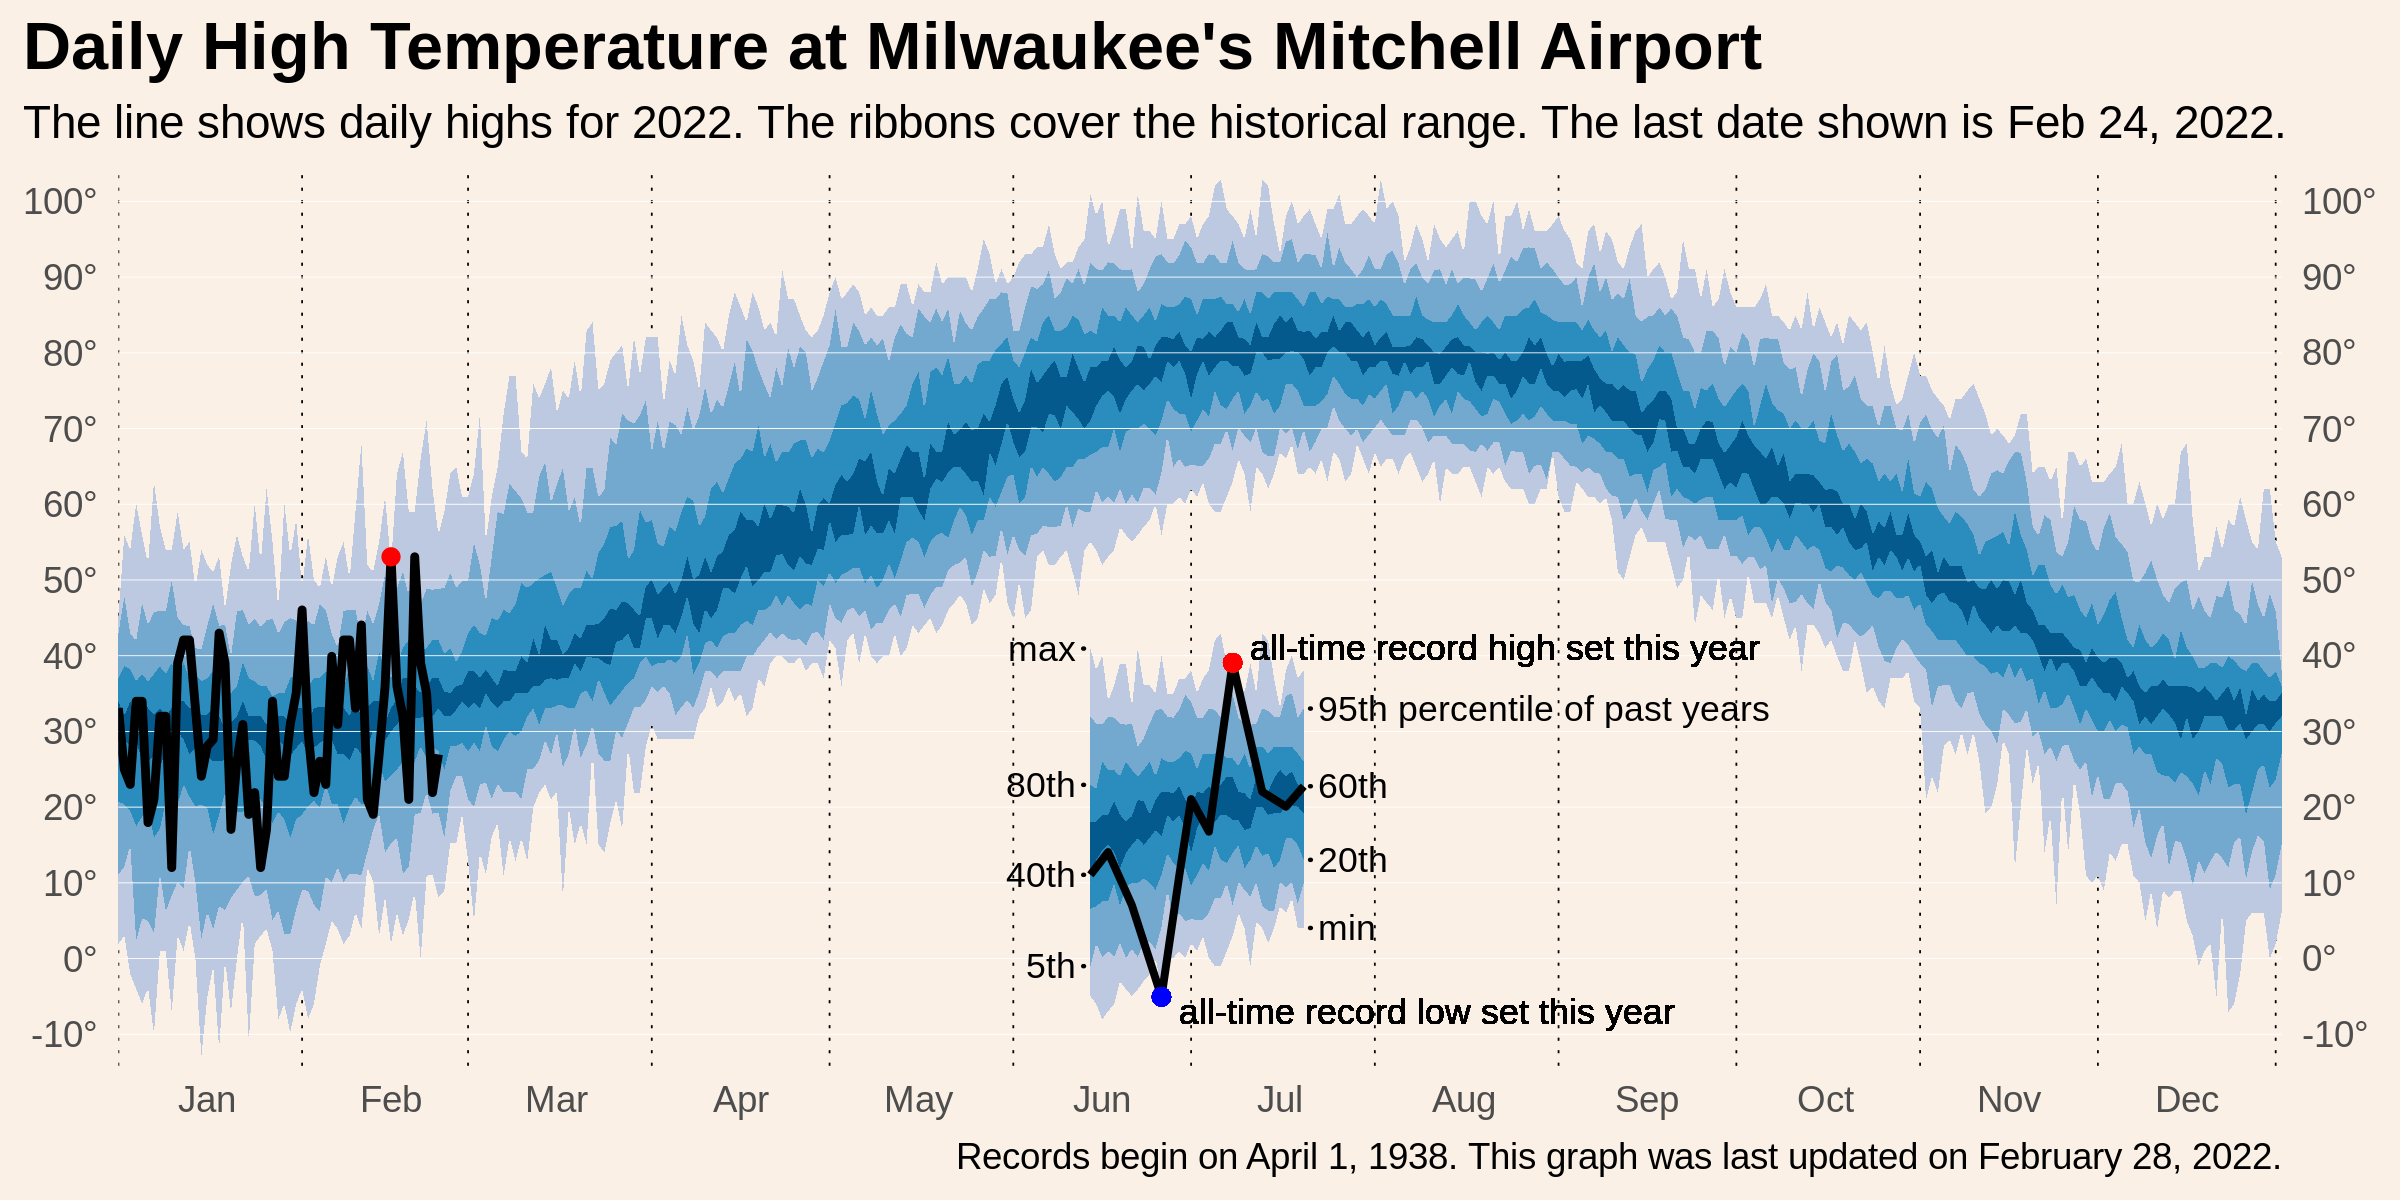
This repository creates the weather graph below (inspired by Edward Tufte) using R's {{ggplot2}} package. Updated data is pulled directly from NOAA's servers in CSV format. The entire process is automated using Github Actions.
This repo may be useful in three ways.
- replicating or adapting this graph for a different weather station
- learning more about data viz with ggplot2
- learning more about Github Actions with R
Full disclosure: I'm a novice Github Actions user. This repo reflects my best understanding of Github Actions, and I plan to update it as my skills improve.
NOAA provides daily data for weather stations in the Global Historical Climatological Network (GHCN).
Citation:
Menne, M.J., I. Durre, B. Korzeniewski, S. McNeal, K. Thomas, X. Yin, S. Anthony, R. Ray, R.S. Vose, B.E. Gleason, and T.G. Houston, 2012: Global Historical Climatology Network - Daily (GHCN-Daily), Version 3.26. NOAA National Climatic Data Center. http://doi.org/10.7289/V5D21VHZ [February 21, 2022].
For every weather station in the daily GHCN, NOAA maintains a file with the station's entire daily history. Each day, they append a new record. In my observation, records are typically lagged by a few days.
Each weather station is assigned a unique indicator. The full list of station names, coordinates, and unique IDs is available here.
I use the station at Milwaukee's General Mitchell Airport, whose code is USW00014839. This station's comprehensive daily dataset is available at https://www1.ncdc.noaa.gov/pub/data/ghcn/daily/by_station/USW00014839.csv.gz. Simply substitute the code of a different station to retrieve its data instead.
Refer to R/Retrieve_GHCN_USW00014839.R for a demonstration of downloading and processing this dataset. See NOAA's documentation for detailed descriptions of the original variable definitions.
The image graphs/DailyHighTemp_USW00014839.png is created by R/BuidlDailyHigh.R. See the README in /graphs for a step-by-step tutorial.
At a high level, the automated workflow:
(1) runs the script to retrieve the updated data
(2) commits the updated dataset to the repository
(3) runs the script to build the graph
(4) commits the graph to the repository. All this takes less than 1 minute per run.
See the README in /.github/workflows for a line-by-line discussion of the workflow file.
