Observability testing with Prometheus and Grafana using docker containers.
Includes a node.js app that publishes a metric which is polled by Prometheus, allowing it to be available in Grafana.
Grafana Datasources and Dashboards are auto-provisioned on creation.
Clone this repo:
git clone https://github.com/tkav/observability-demo \
&& cd observability-demo
Run using docker-compose:
docker-compose up -d
This will start the following services:
| Service | URL |
|---|---|
| Grafana | http://localhost:3000 |
| Prometheus | http://localhost:9090 |
| node-exporter | http://localhost:9100/metrics |
| observability-app | http://localhost:9101/metrics |
Log into Grafana with admin/admin. Set a new password or click Skip.
Grafana is auto-provisioned with a Prometheus datasource (provisioning/datasources/prometheus.yml) and dashboards (provisioning/dashboards/*.json).
If you make changes to prometheus.yml, or want to rebuild Grafana with new provisions, run:
docker-compose up -d --build --force-recreate
The observability-app (node-app) is a node.js app (express server) that publishes a random integer between 5 and 30 called my_nodejs_metric at http://localhost:9101/metrics.
app.get('/metrics', function (req, res) {
    var value = randomInt(5,30)
    res.send('my_nodejs_metric '+value)
})
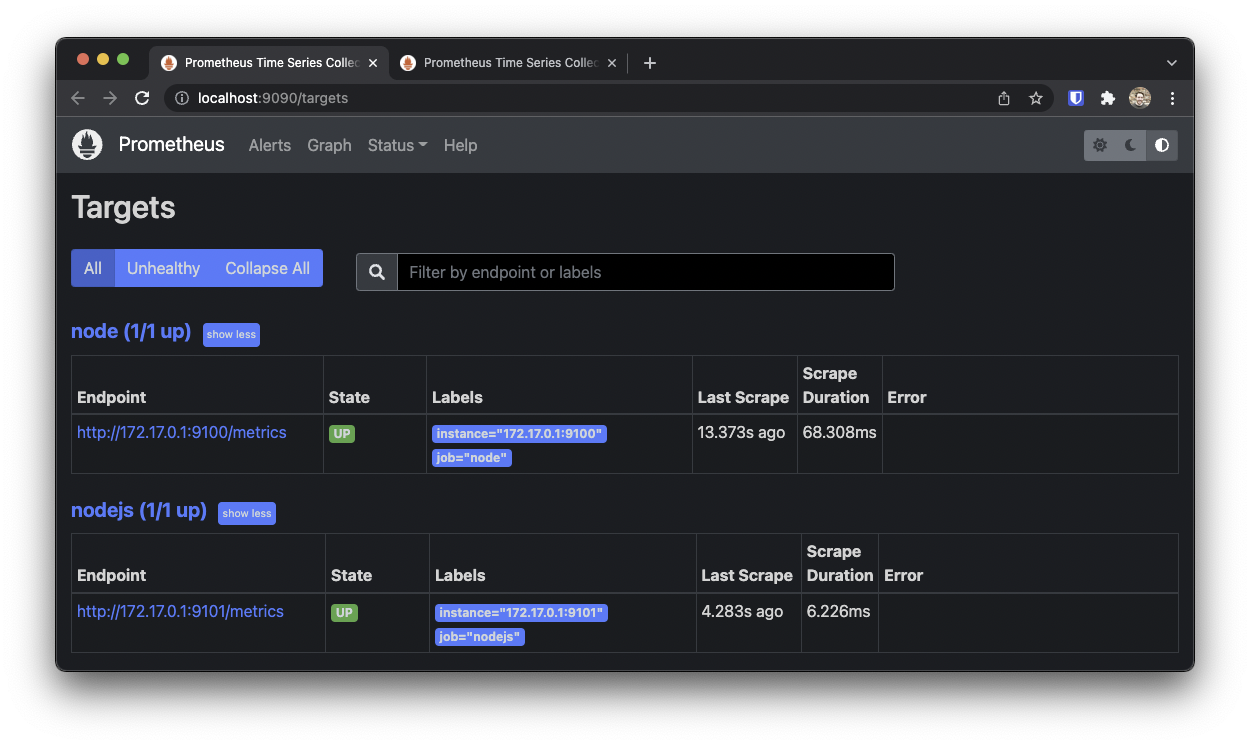
The app is setup as a target in Prometheus (http://localhost:9090/targets):
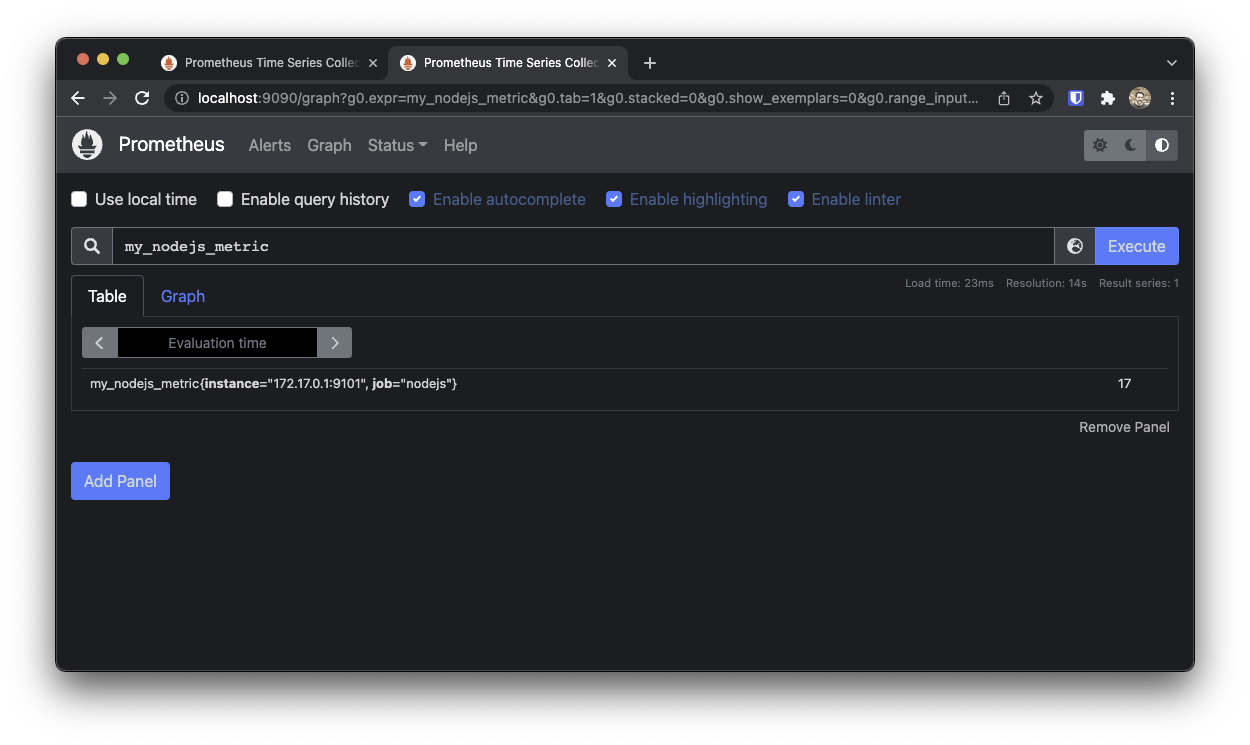
Prometheus scrapes this endpoint, allowing the my_nodejs_metric value to be visible in Grafana.
curl http://localhost:9101/metrics
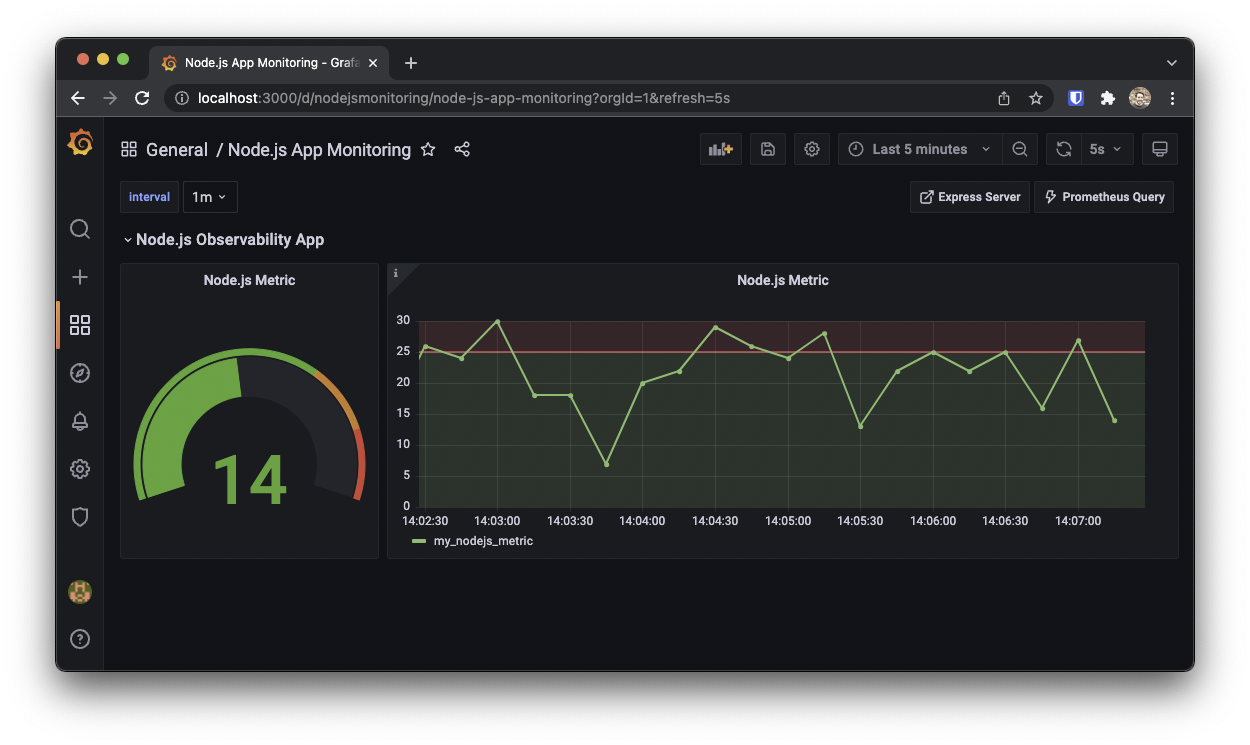
There is a Node.js App Monitoring Dashboard configured in Grafana:
Here you can view the metric from the node.js app and Prometheus. In this example there is a upper threshold of 25. Values above this are shown red.


