This repo provides tools and instructions for deploying and using Google Spark Operator on OpenShift, with custom images including S3 connectors, JMX exporter for monitoring,…
We will first create the custom Spark images (Credits).
From the spark-images folder:
|
Note
|
You can modify the Dockerfiles in the repo to change the Spark, Hadoop or other libraries versions. |
docker build --file spark3.Dockerfile --tag spark-odh:s3.0.1-h3.3.0_v0.0.1 .docker tag spark-odh:s3.0.1-h3.3.0_v0.0.1 your_repo/spark-odh:s3.0.1-h3.3.0_v0.0.1
docker push your_repo/spark-odh:s3.0.1-h3.3.0_v0.0.1docker build --file pyspark.Dockerfile --tag pyspark-odh:s3.0.1-h3.3.0_v0.0.1 --build-arg base_img=spark-odh:s3.0.1-h3.3.0_v0.0.1 .docker tag pyspark-odh:s3.0.1-h3.3.0_v0.0.1 quay.io/guimou/pyspark-odh:s3.0.1-h3.3.0_v0.0.1
docker push quay.io/guimou/pyspark-odh:s3.0.1-h3.3.0_v0.0.1The operator will be installed in its own namespace but will be able to monitor all namespaces for jobs to be launched.
oc new-project spark-operator|
Note
|
From now on all the oc commands are supposed to be run in the context of this project.
|
The operator needs a special Service Account and Role to create pods and services.
From the spark-operator folder:
oc apply -f spark-rbac.yamlWe will use the standard version of the Google Spark Operator.
helm repo add spark-operator https://googlecloudplatform.github.io/spark-on-k8s-operatorhelm install spark-operator spark-operator/spark-operator --namespace spark-operator --create-namespace --set image.tag=v1beta2-1.2.3-3.1.1 --set webhook.enable=true --set resourceQuotaEnforcement.enable=trueWe will monitor the Spark operator itself, as well as the applications it creates.
|
Note
|
Prerequisites: Prometheus and Grafana must be installed in your environment. The easiest way is to use the operators. An instance of Grafana must be created so that the ServiceAccount is provisioned. |
From spark-operator folder:
oc apply -f spark-application-metrics_svc.yaml
oc apply -f spark-operator-metrics_svc.yamloc apply -f spark-service-monitor.yamloc apply -f prometheus-datasource.yaml|
Note
|
We will need another datasource to retrieve base CPU and RAM metrics. To do that we’ll connect to the "main" OpenShift Prometheus through the following procedure. |
oc adm policy add-cluster-role-to-user cluster-monitoring-view -z grafana-serviceaccountexport BEARER_TOKEN=$(oc serviceaccounts get-token grafana-serviceaccount)Deploy main-prometheus-datasource.yaml file with the BEARER_TOKEN value.
cat main-prometheus-datasource.yaml | sed -e "s/BEARER_TOKEN/$BEARER_TOKEN/g" | oc apply -f -oc apply -f spark-operator-dashboard.yaml
oc apply -f spark-application-dashboard.yamlAll the following commands are executed from the spark-history-server folder.
We will use object storage to store the logs data from the Spark jobs. We will first need to create a bucket.
oc apply -f spark-hs-obc.yaml|
Important
|
The Spark/Hadoop instances cannot log direclty into a bucket. A "folder" must exist where the logs will be sent. We will trick Spark/Hadoop into creating this folder by uploading a hidden file to the location we want this folder. |
Retrieve the Access and Secret Key from the Secret named obc-spark-history-server, the name of the bucket from the ConfigMap named obc-spark-history-server as well as the Route to the S3 storage (you may have to create it to access the RGW, default S3 Route in ODF points to MCG).
export AWS_ACCESS_KEY_ID=YOUR_ACCESS_KEY
export AWS_SECRET_ACCESS_KEY=YOUR_SECRET_ACCESS_KEY
aws --endpoint-url YOUR_ROUTE_TO_S3 s3 cp YOUR_FILE s3://YOUR_BUCKET_NAME/logs-dir/.s3keep
Renaming this file .s3keep will mark it as hidden from from the History Server and Spark logging mechanism perspective, but the "folder" will appear as being present, making everyone happy!
We can do a quick test/demo with the standard word count example from Shakespeare’s sonnets.
We’ll create a bucket using and ObjectBucketClaim, and populate it with the data.
|
Note
|
This OBC creates a bucket in the RGW from an OpenShift Data Foundation deployment. Adapt the instructions depending on your S3 provider. |
From the test folder:
oc apply -f obc.yamlRetrieve the Access and Secret Key from the Secret named spark-demo, the name of the bucket from the ConfigMap named spark-demo as well as the Route to the S3 storage (you may have to create it to access the RGW, default S3 Route in ODF points to MCG).
shakespeare.txt, to the bucket (here using the AWS CLI)export AWS_ACCESS_KEY_ID=YOUR_ACCESS_KEY
export AWS_SECRET_ACCESS_KEY=YOUR_SECRET_ACCESS_KEY
aws --endpoint-url YOUR_ROUTE_TO_S3 s3 cp shakespeare.txt s3://YOUR_BUCKET_NAME/shakespeare.txt|
Tip
|
If your endpoint is using a self-signed certificate, you can add --no-verify-ssl to the command.
|
Our application file is wordcount.py that you can find in the folder. To make it accessible to the Spark Application, it is packaged as data inside a Config Map. This CM will be mounted as a Volume inside our Spark Application YAML definition.
oc apply -f wordcount_configmap.yamlWe are now ready to launch our Spark Job using the SparkApplication CRD from the operator. Our YAML definition will:
-
Use the application file (wordcount.py) from the ConfigMap mounted as a volume
-
Inject the Endpoint, Bucket, Access and Secret Keys inside the containers definition so that the driver and the workers can retrieve the data to process it
oc apply -f spark_app_shakespeare.yamlIf you look at the OpenShift UI you will see the driver, then the workers spawning. They will execute the program, then terminate.
You can now retrieve the results:
aws --endpoint-url YOUR_ROUTE_TO_S3 s3 ls s3://YOUR_BUCKET_NAME/You will see that the results have been saved in a location called sorted_count_timestamp.
aws --endpoint-url YOUR_ROUTE_TO_S3 s3 cp s3://YOUR_BUCKET_NAME/sorted_counts_timestamp ./ --recursiveThere should be different files:
-
_SUCCESS: just an indicator -
part-00000andpart-00001: the results themselves that will look like:
('', 2832)
('and', 490)
('the', 431)
('to', 414)
('my', 390)
('of', 369)
('i', 339)
('in', 323)
('that', 322)
('thy', 287)
('thou', 234)
('with', 181)
('for', 171)
('is', 167)
('not', 166)
('a', 163)
('but', 163)
('love', 162)
('me', 160)
('thee', 157)
....
So the sorted list of all the words with their occurences in the full text.
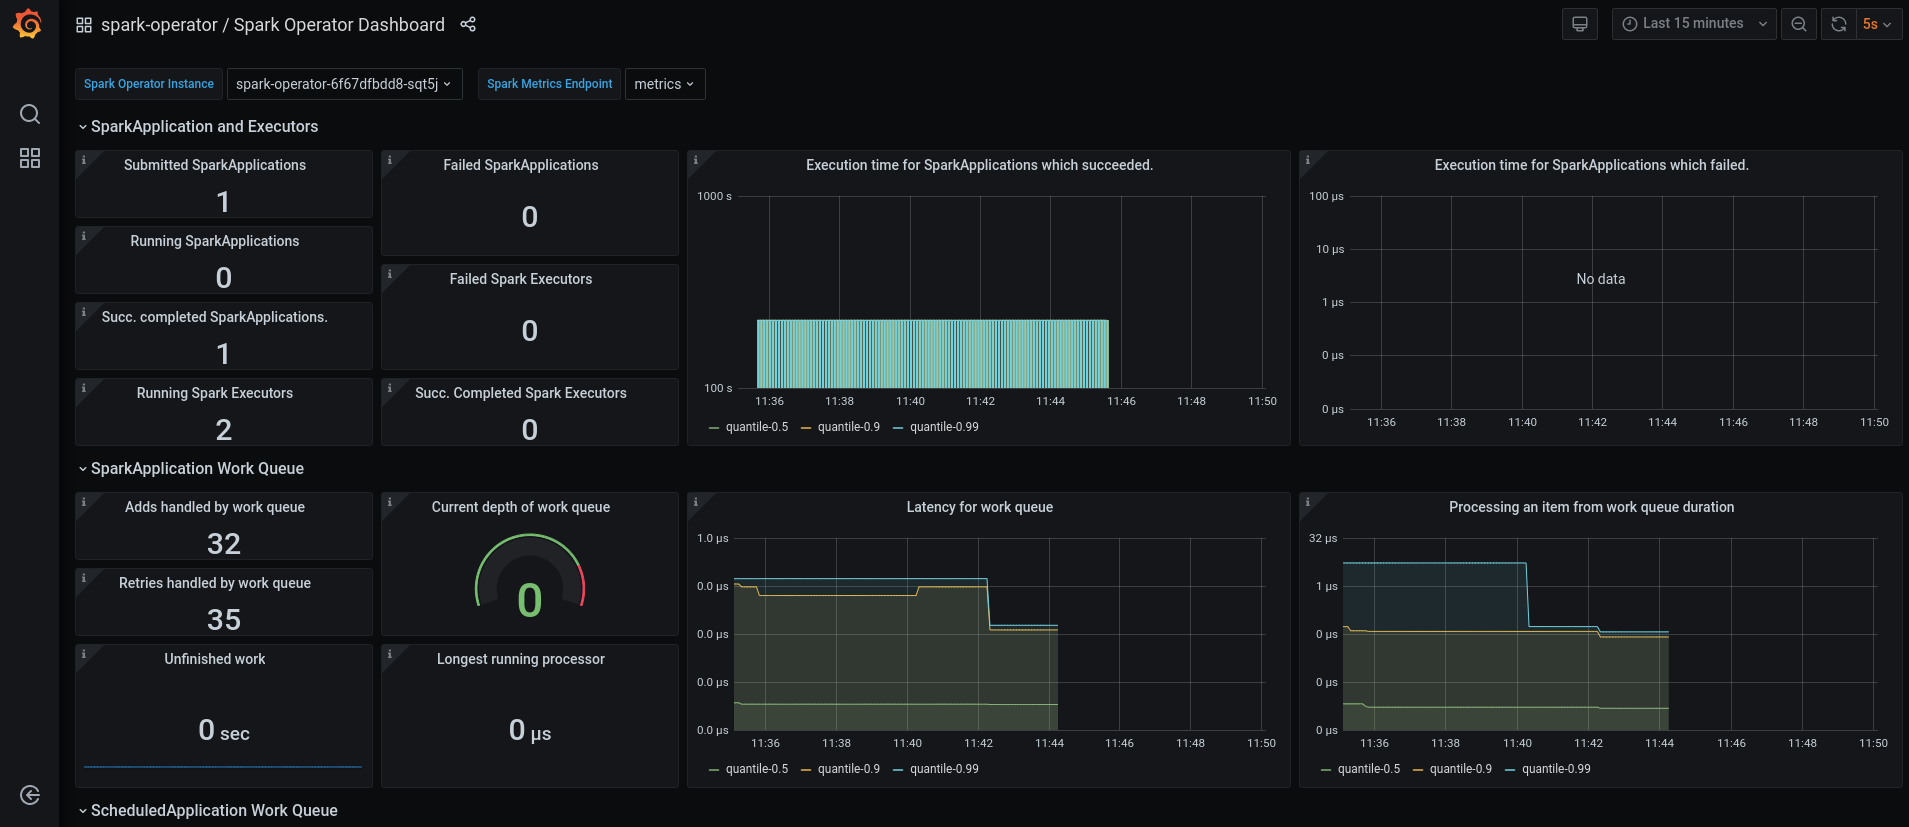
While a job is running you can also have a look at the Grafana dashboards for something like this:

