An R package for calculating and plotting binomial credible intervals. It was written for educational purposes and not necessarily for serious use.
devtools::install_github("tmalsburg/binomialCRIs")Note: When plotting to PDF, use the function cairo_pdf() instead of pdf() to get Greek characters in the results.
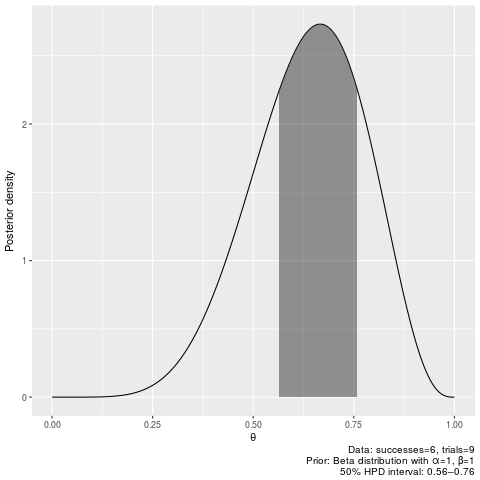
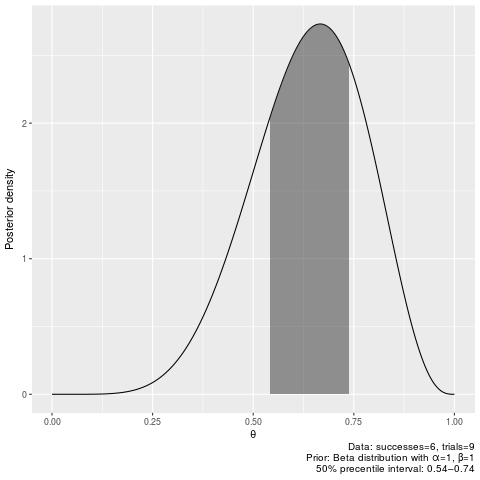
50% credible intervals after seeing 6 successes out of 9 trials, with flat prior:
library(binomialCRIs)

binomial_hpdi(n_successes=6, n_trials=9, prob=0.5, prior_shape1=1, prior_shape2=1)
|0.5 0.5| 0.5643603 0.7593849
plot_binomial_hpdi(6, 9, 0.5)binomial_pi(6, 9, 0.5)|0.5 0.5| 0.5423038 0.7391494
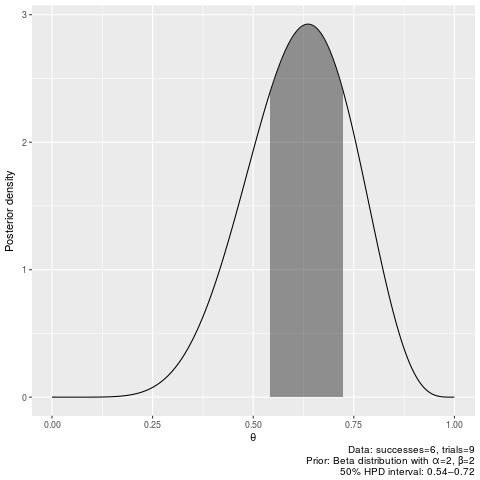
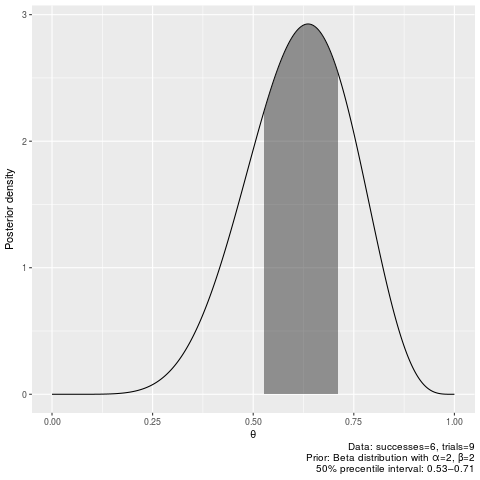
plot_binomial_pi(6, 9, 0.5)50% credible intervals after seeing 6 successes out of 9 trials, with prior assuming one earlier success and one earlier failure:
binomial_hpdi(6, 9, 0.5, 2, 2)|0.5 0.5| 0.5419229 0.7242251
plot_binomial_hpdi(6, 9, 0.5, 2, 2)binomial_pi(6, 9, 0.5, 2, 2)|0.5 0.5| 0.5269063 0.7101529
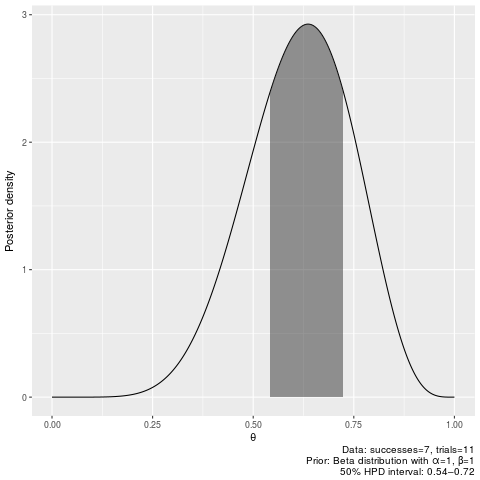
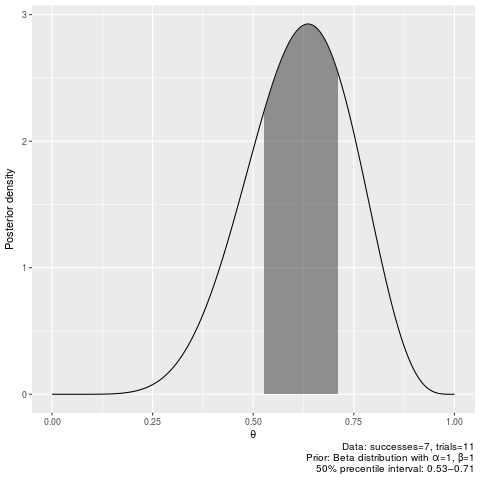
plot_binomial_pi(6, 9, 0.5, 2, 2)50% credible intervals after seeing 7 successes our of 11 trials (equivalent to 6/9 with prior_shape1=2, beta=2):
binomial_hpdi(7, 11, 0.5, 1, 1)|0.5 0.5| 0.5419229 0.7242251
plot_binomial_hpdi(7, 11, 0.5)binomial_pi(7, 11, 0.5)|0.5 0.5| 0.5269063 0.7101529
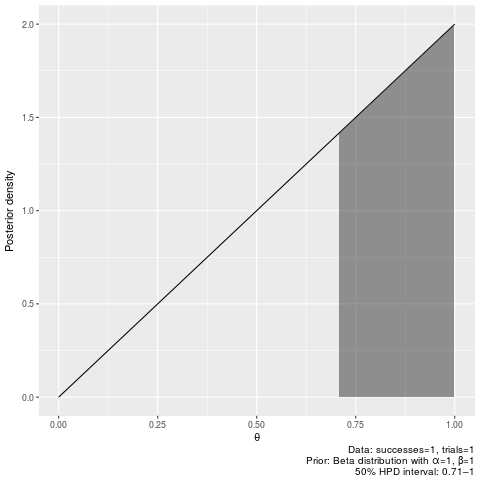
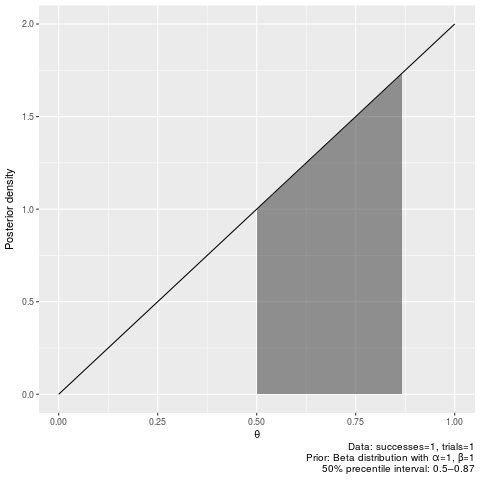
plot_binomial_pi(7, 11, 0.5)50% credible intervals after seeing 1 successes out of 2 trials, with flat prior:
binomial_hpdi(1, 1, 0.5)|0.5 0.5| 0.7070744 0.9999771
plot_binomial_hpdi(1, 1, 0.5)binomial_pi(1, 1, 0.5)|0.5 0.5| 0.5000000 0.8660254
plot_binomial_pi(1, 1, 0.5)Probability of parameter being larger than 0.5 after seeing 6 successes out of 9 trials with flat prior:
binomial_prob(6, 9, 0.5)[1] 0.828125
Probability of parameter being larger than 0.5 after seeing 6 successes out of 9 trials with prior assuming one earlier success and one earlier failure:
binomial_prob(6, 9, 0.5, prior_shape1=2, prior_shape2=2)[1] 0.8061523
Probability of parameter being smaller than 0.5 after seeing 6 successes out of 9 trials with prior assuming one earlier success and one earlier failure:
binomial_prob(6, 9, prob_upper=0.5, prior_shape1=2, prior_shape2=2)[1] 0.1938477
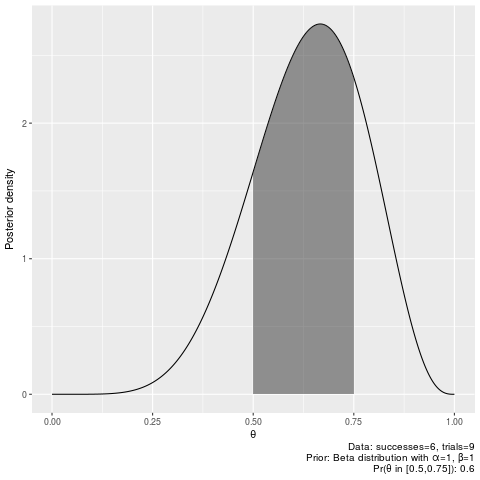
Probability of parameter being larger than 0.5 and smaller than 0.75 after seeing 6 successes our of 9 trials:
binomial_prob(6, 9, 0.5, 0.75)[1] 0.6040001
Plot the same interval:
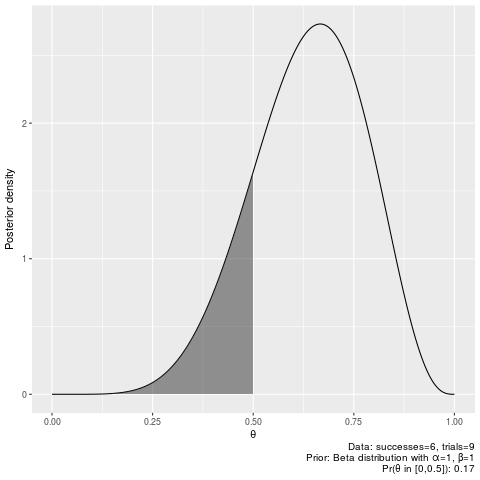
plot_binomial_cri(6, 9, 0.5, 0.75)Probability of parameter being smaller than 0.5 after seeing 6 successes our of 9 trials:
binomial_prob(6, 9, prob_upper=0.5)[1] 0.171875
Plot:
plot_binomial_cri(6, 9, prob_upper=0.5)