fibers-server is an evaluation server based on Jetty for virtual threads (fibers) provided by Project Loom
Early-Access builds. The server provides a sync and an async servlet handlers that can be configured to serve requests including more or less waiting (IO and idle) and service time (CPU). The server can be started with a queued or unbounded thread pool. Both pools can be backed by virtual or kernel threads.
Setup Project Loom early-access build by following the instructions.
$ java -version
openjdk version "16-loom" 2021-03-16
OpenJDK Runtime Environment (build 16-loom+4-56)
OpenJDK 64-Bit Server VM (build 16-loom+4-56, mixed mode, sharing)
mvn clean:install
Print help usage via
docker run -p 8080:8080 -i tmaretdotio/fibers-server:0.0.2 -h
Run a server using kernel threads and unbounded pool
docker run -p 8080:8080 -i tmaretdotio/fibers-server:0.0.2 -t kernel
Run the server using lightweight threads (fibers) and unbounded pool
docker run -p 8080:8080 -i tmaretdotio/fibers-server:0.0.2 -t fibers
Run the server with bounded pool (400) and lightweight threads
docker run -p 8080:8080 -i tmaretdotio/fibers-server:0.0.2 -t fibers -c 400
Request served by a sync servlet
curl http://localhost:8080/sync
Request served by an async servlet
curl http://localhost:8080/async
Specify the amount of work performed by the servlet before returning the response.
curl 'http://localhost:8080/sync?cpuIterations=10000&idleDelay=0&fileLength=100000'
| Request Parameter | Definition |
|---|---|
cpuIterations |
The number of SHA256 iterations on a 256 byte array. Default is 10'000 iterations and corresponds to ~ 3ms on a 2.3 GHz Intel Core i9. |
idleDelay |
The time to sleep in ms. Default is 0ms. |
fileLength |
The length in bytes of the file returned. The file is auto-generated and served from disk. Default length is 100KB. |
The following table summarises the fibers-server throughput under load generated by wrk2.
Throughputs values labeled fibers refer to the fibers-server running with an unbounded pool of virtual threads.
Throughput values labeled kernel refer to the fibers-server running with a queued pool of 1000 kernel threads.
Workload consists of 80% sleep, 15% IO and 5% CPU. The raw results are here.
The server and load generator are deployed as two containers inside a single Kubernetes Pod communicating via localhost on the shared network interface.
The load generator was allocated 8 cores and 16GB memory. The server was allocated 4 cores and 3GB memory. ✋ The server %CPU topped 400% for higher concurrency and was thus limiting the throughput.
| Concurrency (threads) | fibers req/s | kernel req/s |
|---|---|---|
| 100 | 3411 | 2183 |
| 250 | 3272 | 2150 |
| 500 | 3350 | 2012 |
| 1000 | 3187 | 1828 |
| 2000 | 3265 | 1863 |
| 4000 | 3055 | 1839 |
| Concurrency (threads) | fibers req/s | kernel req/s |
|---|---|---|
| 100 | 330 | 256 |
| 250 | 316 | 248 |
| 500 | 334 | 240 |
| 1000 | 323 | 186 |
| 2000 | 322 | 173 |
| 4000 | 325 | 177 |
The N/A values indicates the test could not complete.
| Concurrency (threads) | fibers req/s | kernel req/s |
|---|---|---|
| 100 | 31 | 24 |
| 250 | 30 | 19 |
| 500 | 30 | 13 |
| 1000 | 31 | N/A |
| 2000 | 32 | N/A |
| 4000 | 29 | N/A |
Workload consists of 95% sleep, 4% IO and 1% CPU. The raw results are here.
The server and load generator are deployed as two containers inside a single Kubernetes Pod communicating via localhost on the shared network interface.
The load generator was allocated 8 cores and 16GB memory. The server was allocated 4 cores and 3GB memory. ✋ The server %CPU topped 400% for higher concurrency and was thus limiting the throughput.
| Concurrency (threads) | fibers req/s | kernel req/s |
|---|---|---|
| 100 | 9723 | 9193 |
| 250 | 13735 | 10047 |
| 500 | 13942 | 9683 |
| 1000 | 13754 | 9355 |
| 2000 | 14350 | 10190 |
| 4000 | 12973 | 10045 |
| Concurrency (threads) | fibers req/s | kernel req/s |
|---|---|---|
| 100 | 1012 | 1025 |
| 250 | 1925 | 1850 |
| 500 | 1944 | 1797 |
| 1000 | 1953 | 1523 |
| 2000 | 1871 | 1623 |
| 4000 | 1918 | 1570 |
| Concurrency (threads) | fibers req/s | kernel req/s |
|---|---|---|
| 100 | 100 | 99 |
| 250 | 206 | 197 |
| 500 | 206 | 221 |
| 1000 | 198 | 175 |
| 2000 | 199 | 173 |
| 4000 | 198 | 169 |
Workload consists of 95% sleep, 4% IO and 1% CPU. The raw results are here.
The server and load generator are deployed as two Kubernetes Pods communicating using Kubernetes cluster routing.
The load generator was allocated 8 cores and 16GB memory. The server was allocated 4 cores and 3GB memory. ✋ The server %CPU topped 400% for higher concurrency and was thus limiting the throughput.
| Concurrency (threads) | fibers req/s | kernel req/s |
|---|---|---|
| 100 | 9633 | 9214 |
| 250 | 14181 | 9444 |
| 500 | 14618 | 9007 |
| 1000 | 13372 | 8415 |
| 2000 | 13406 | 9485 |
| 4000 | 12574 | 9643 |
| Concurrency (threads) | fibers req/s | kernel req/s |
|---|---|---|
| 100 | 1027 | 1022 |
| 250 | 1980 | 1663 |
| 500 | 1973 | 1592 |
| 1000 | 1938 | 1530 |
| 2000 | 1885 | 1554 |
| 4000 | 2056 | 1577 |
| Concurrency (threads) | fibers req/s | kernel req/s |
|---|---|---|
| 100 | 100 | 97 |
| 250 | 202 | 172 |
| 500 | 206 | 176 |
| 1000 | 203 | 156 |
| 2000 | 197 | 151 |
| 4000 | 212 | 168 |
The N/A values indicates the test could not complete.
| Concurrency (threads) | fibers req/s | kernel req/s |
|---|---|---|
| 100 | 8 | 4 |
| 250 | 12 | 10 |
| 500 | 8 | 0 |
| 1000 | 11 | N/A |
| 2000 | 10 | N/A |
| 4000 | 11 | N/A |
Workload consists of 95.5% sleep, 4% IO and 0.5% CPU. The raw results are here.
The server and load generator are deployed as two Kubernetes Pods communicating using Kubernetes cluster routing.
The load generator was allocated 8 cores and 16GB memory. The server was allocated 8 cores and 3GB memory.
👍 Throughput was not limited by server 8 cores. %CPU usage remained < 800% during the test.
| Concurrency (threads) | fibers req/s | kernel req/s |
|---|---|---|
| 100 | 10262 | 10342 |
| 250 | 25468 | 24383 |
| 500 | 32888 | 24898 |
| 1000 | 34615 | 24300 |
| 2000 | 34818 | 25245 |
| 4000 | 35678 | 24589 |
| 8000 | 36942 | 29906 |
| Concurrency (threads) | fibers req/s | kernel req/s |
|---|---|---|
| 100 | 1006 | 1008 |
| 250 | 2523 | 2515 |
| 500 | 4926 | 4683 |
| 1000 | 5387 | 4423 |
| 2000 | 5384 | 4551 |
| 4000 | 5355 | 4336 |
| 8000 | 6235 | 4923 |
| Concurrency (threads) | fibers req/s | kernel req/s |
|---|---|---|
| 100 | 98 | 97 |
| 250 | 239 | 230 |
| 500 | 398 | 315 |
| 1000 | 406 | 270 |
| 2000 | 410 | 257 |
| 4000 | 402 | 285 |
| 8000 | 452 | 325 |
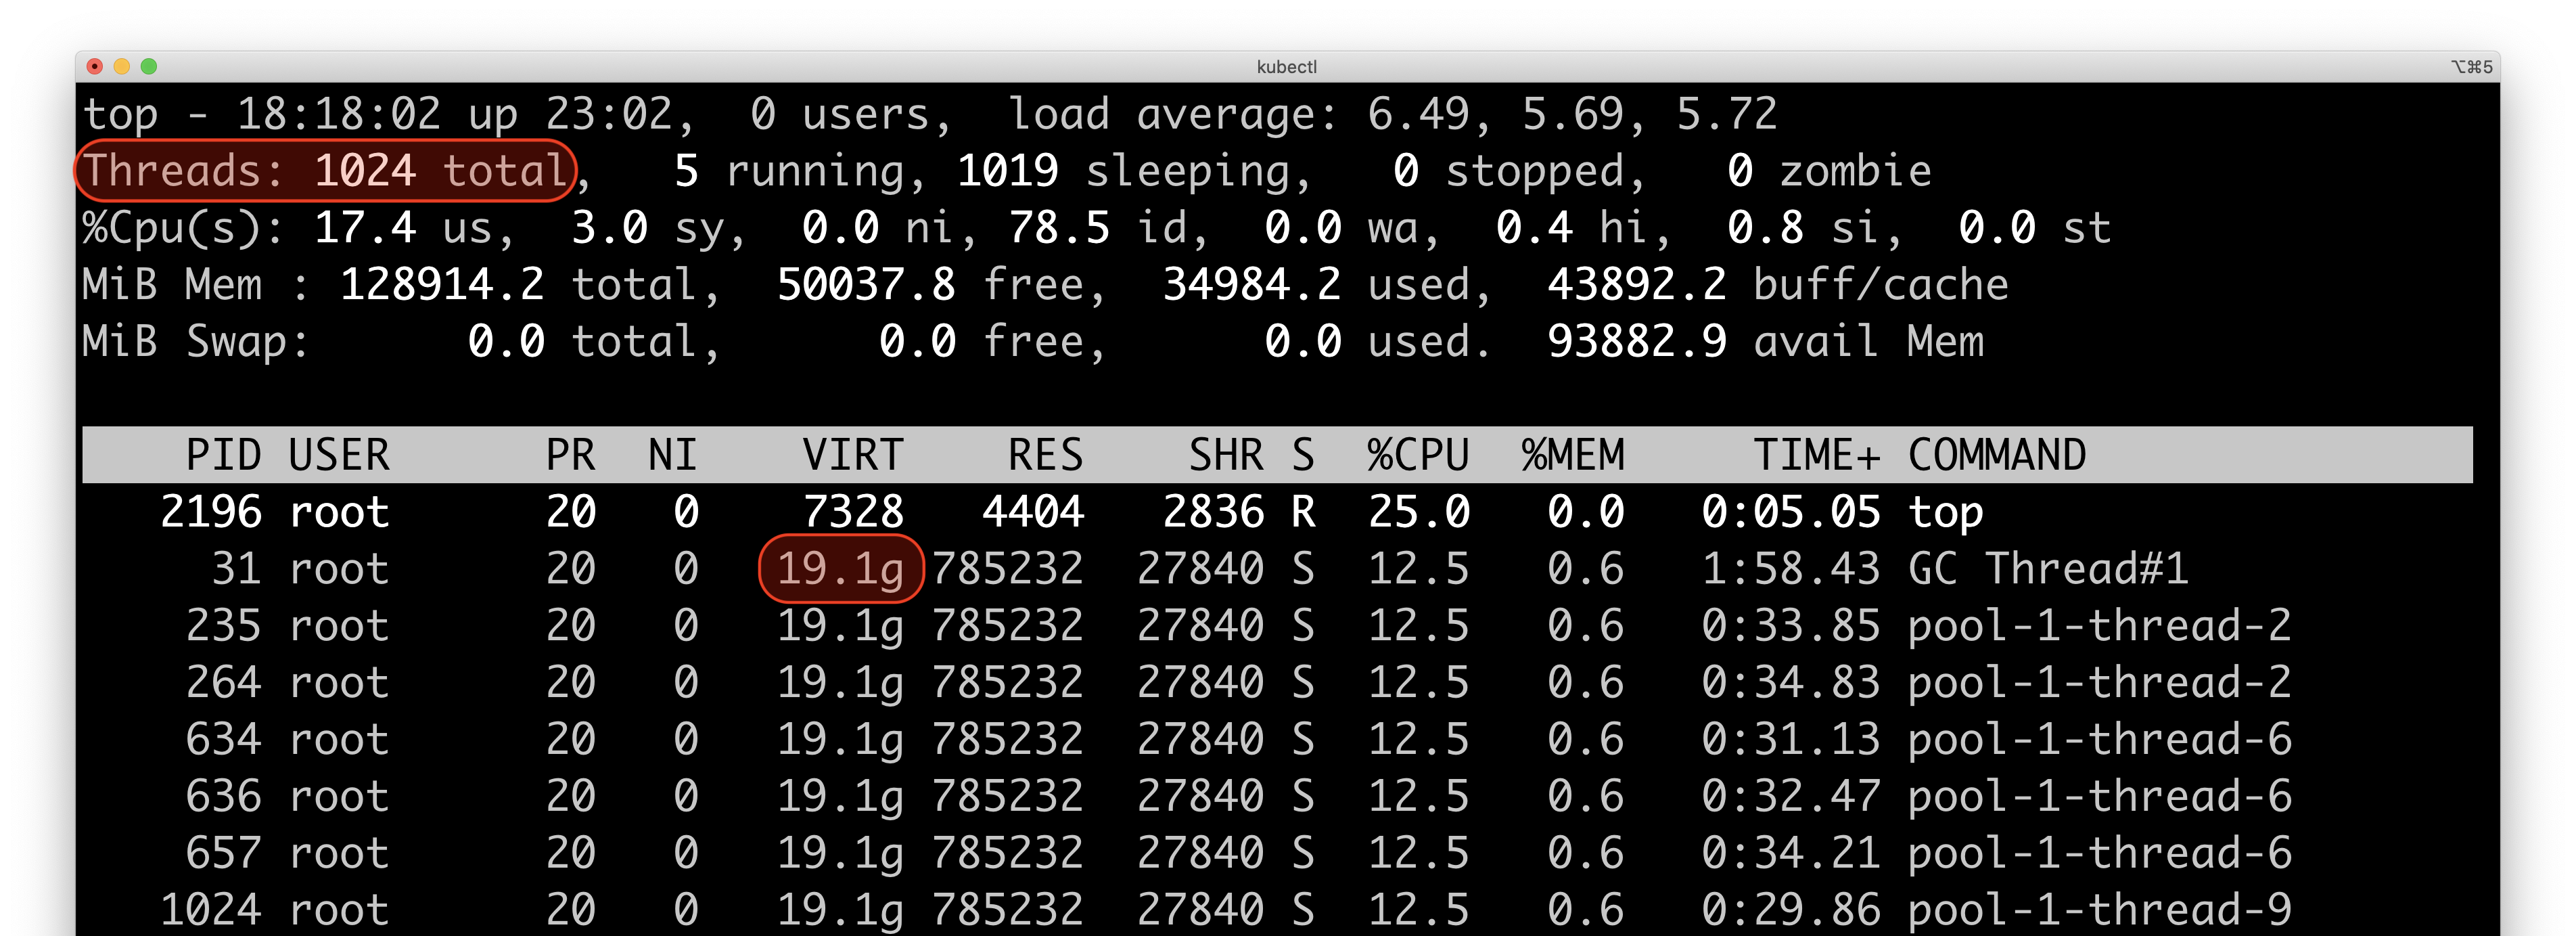
Using top while benchmarking the server with 4000 concurrency shows ~ 1000 kernel threads to support the kernel server mode
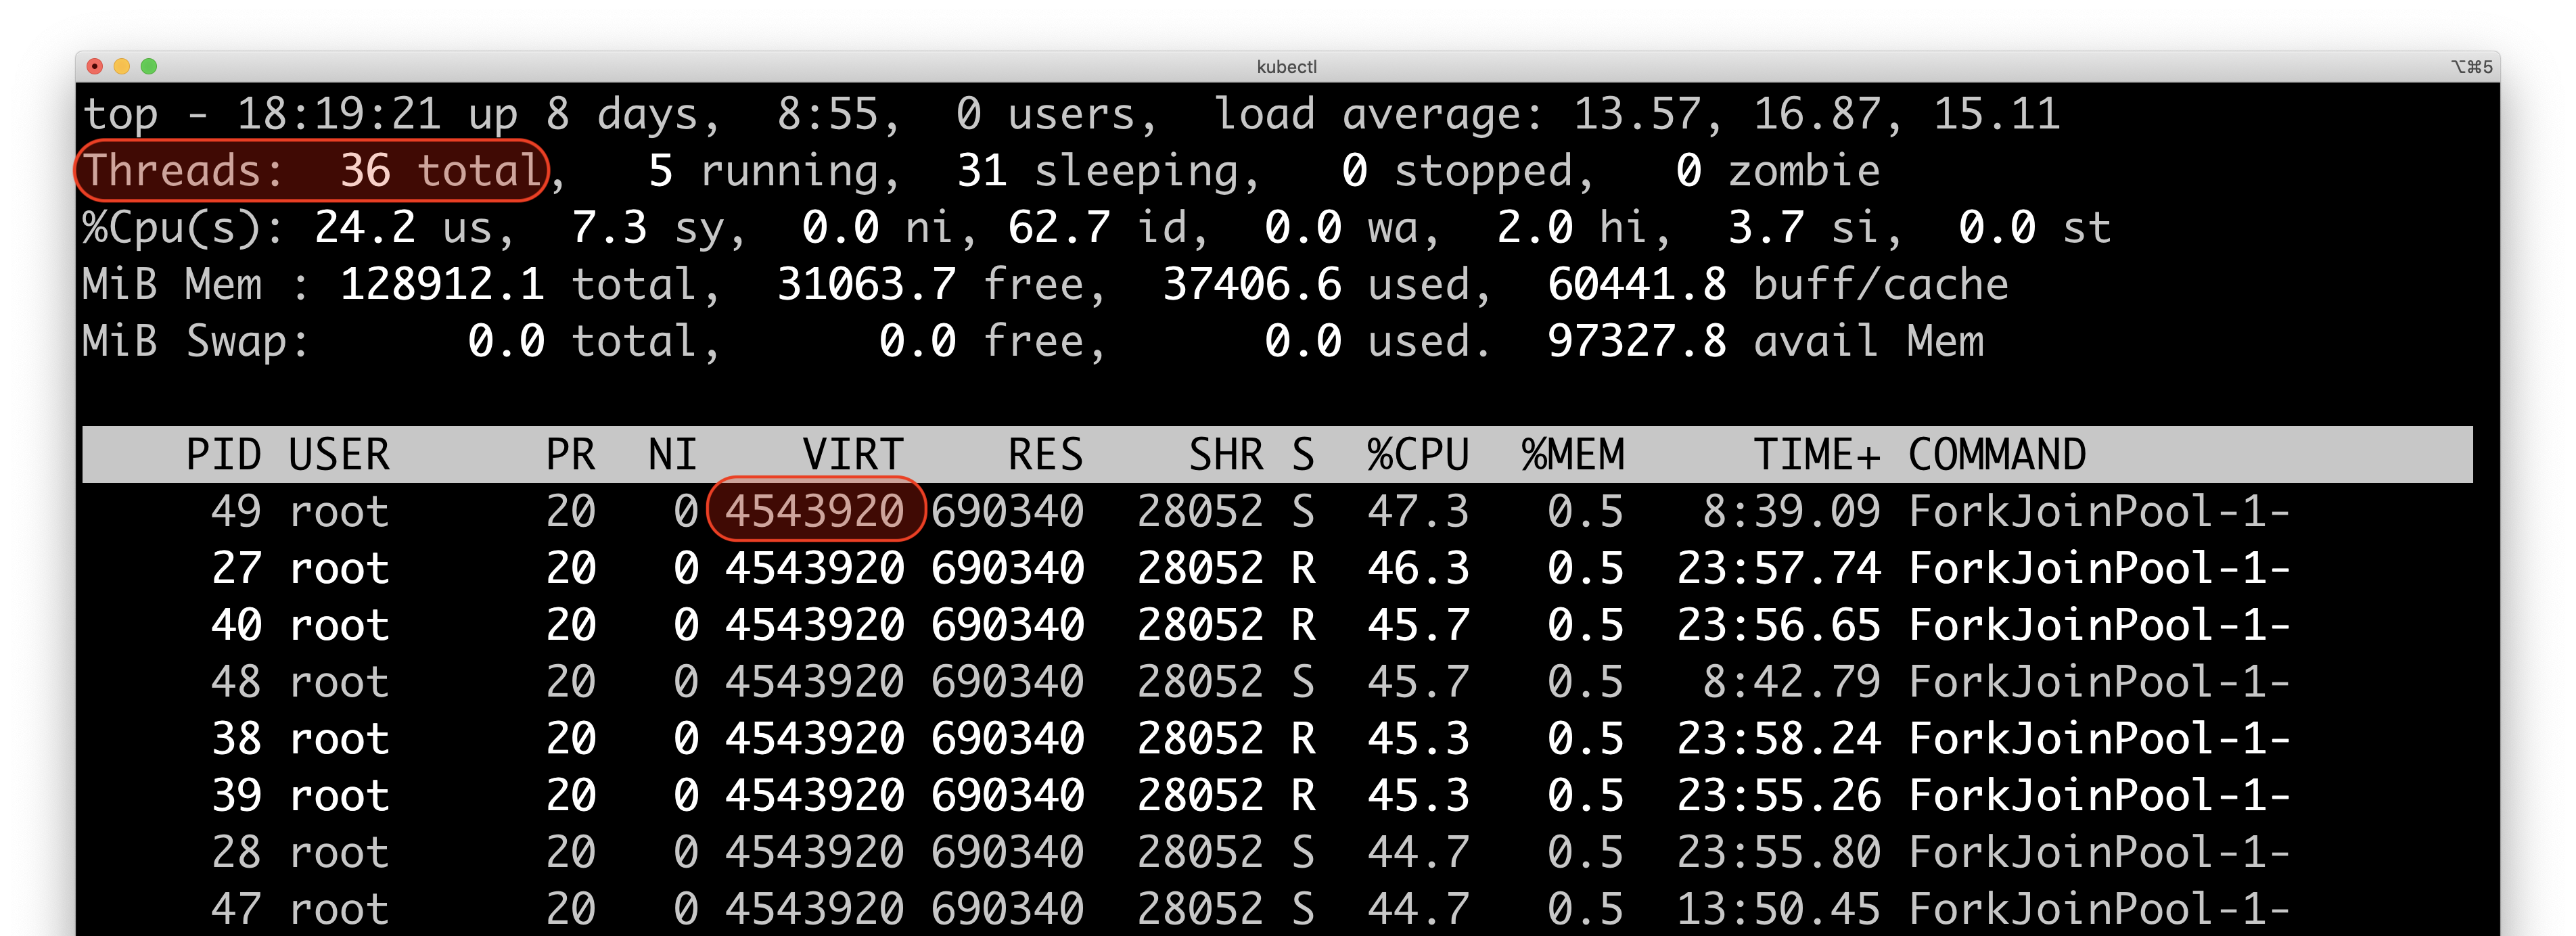
and ~ 10 kernel threads to support the fibers server mode

