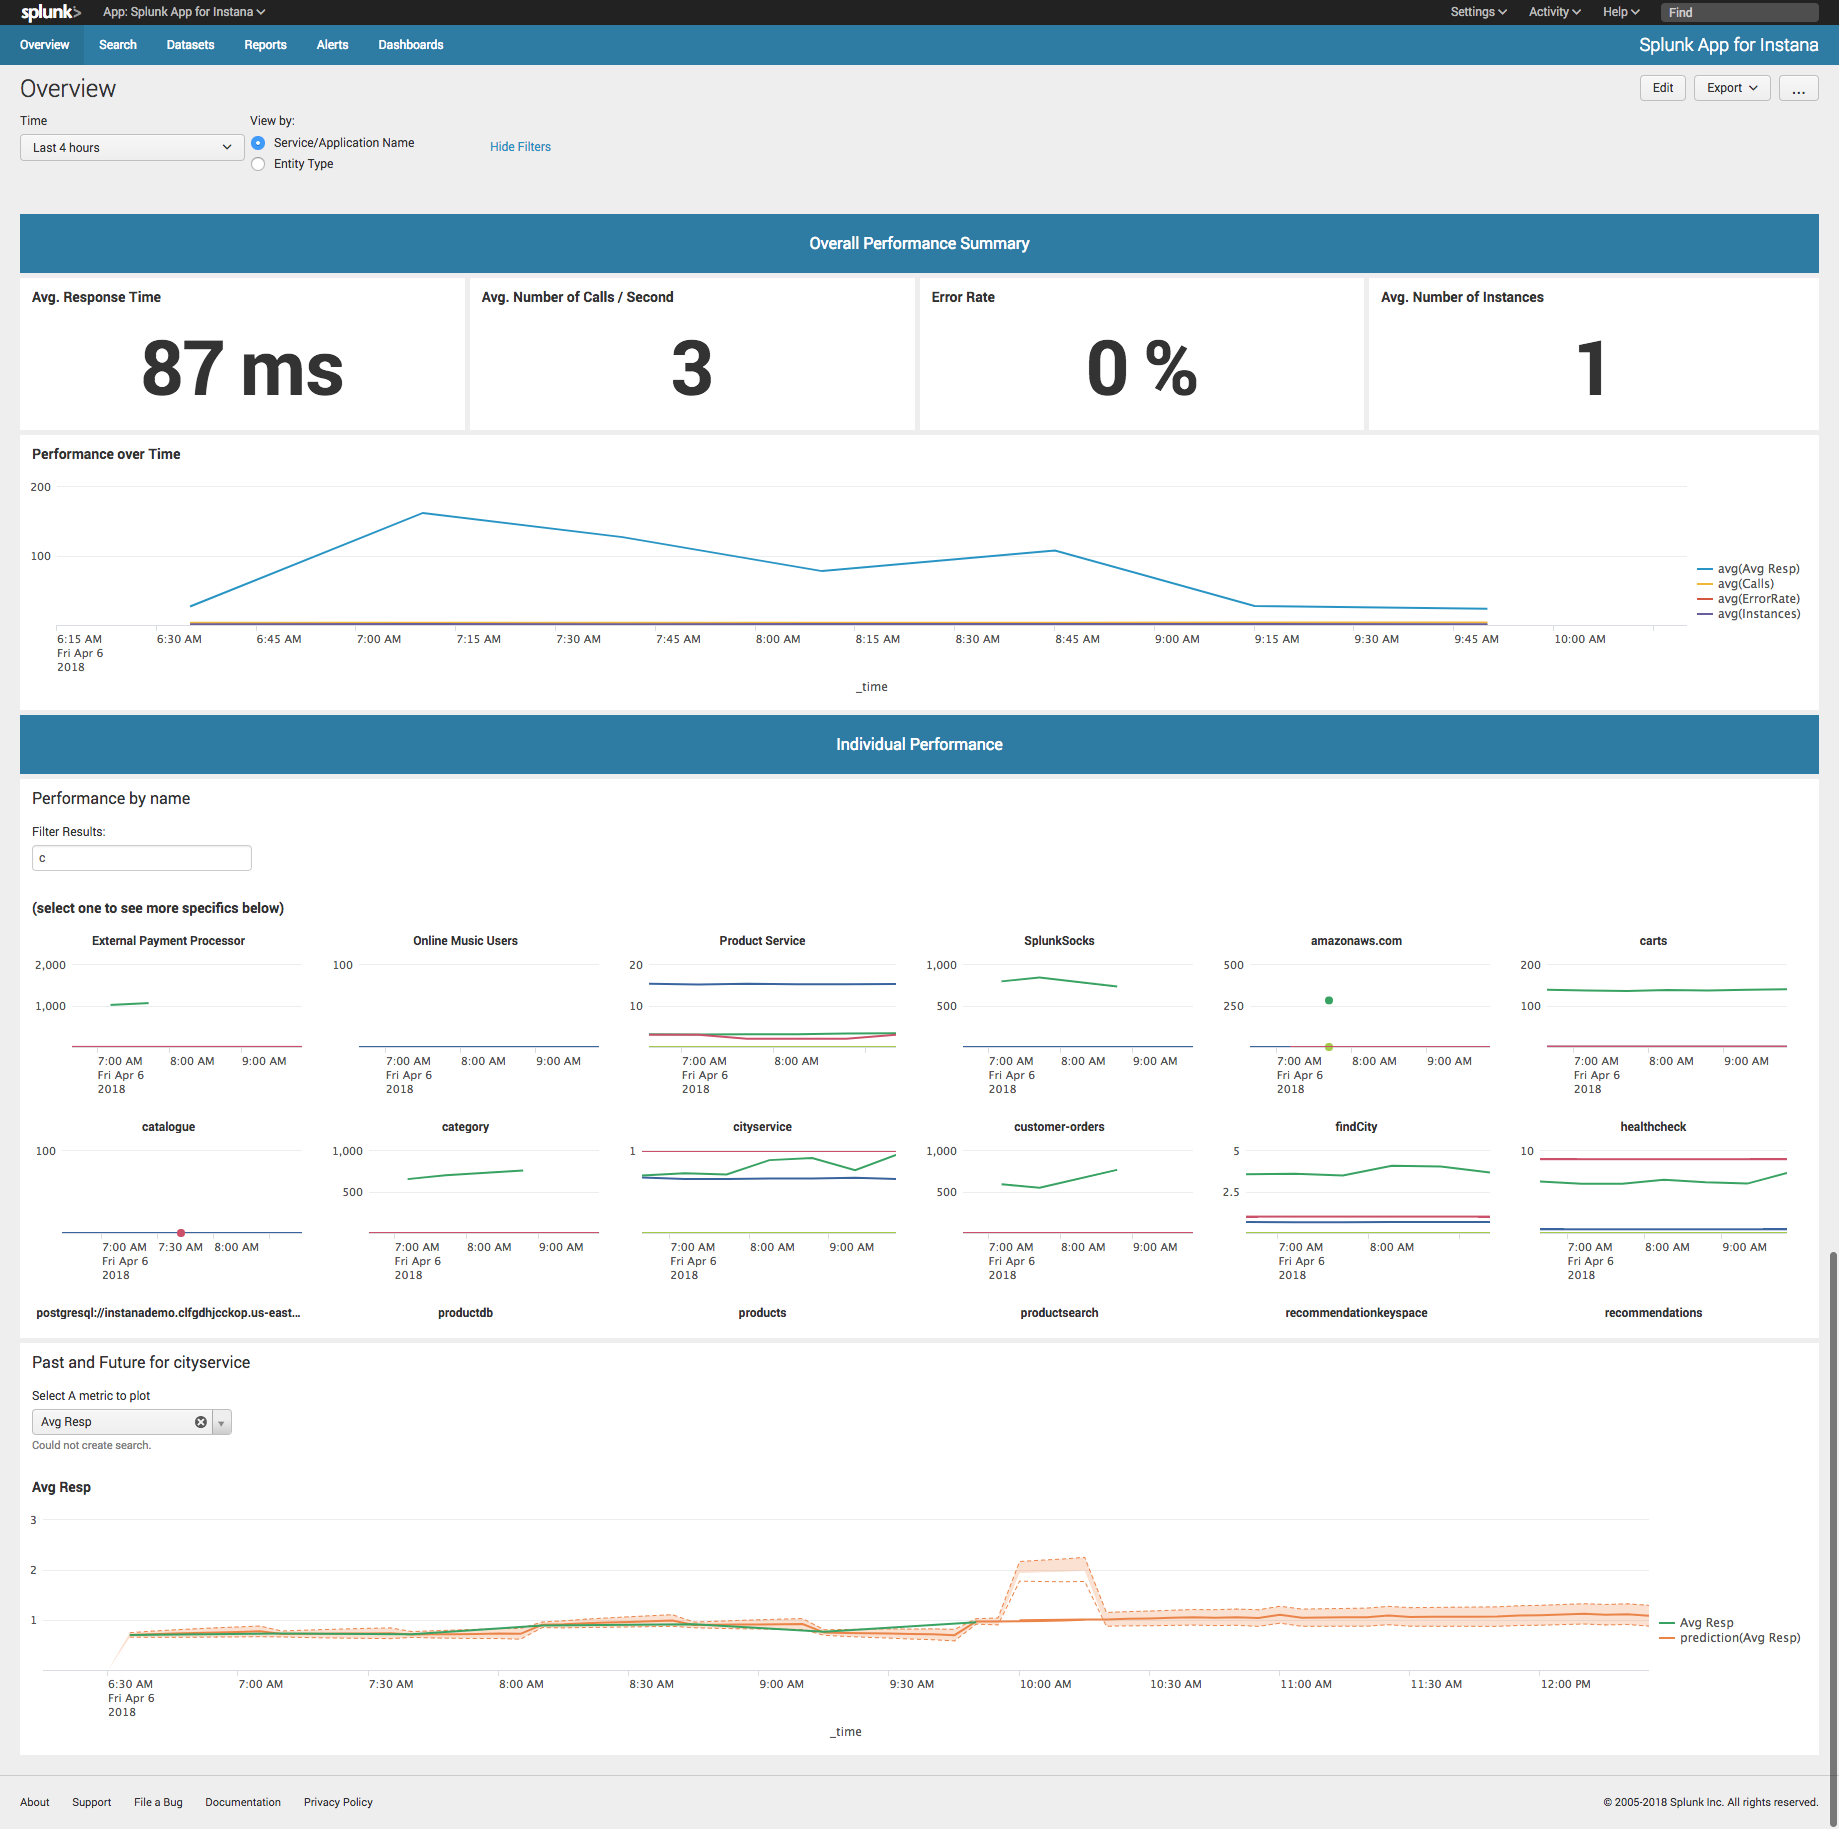
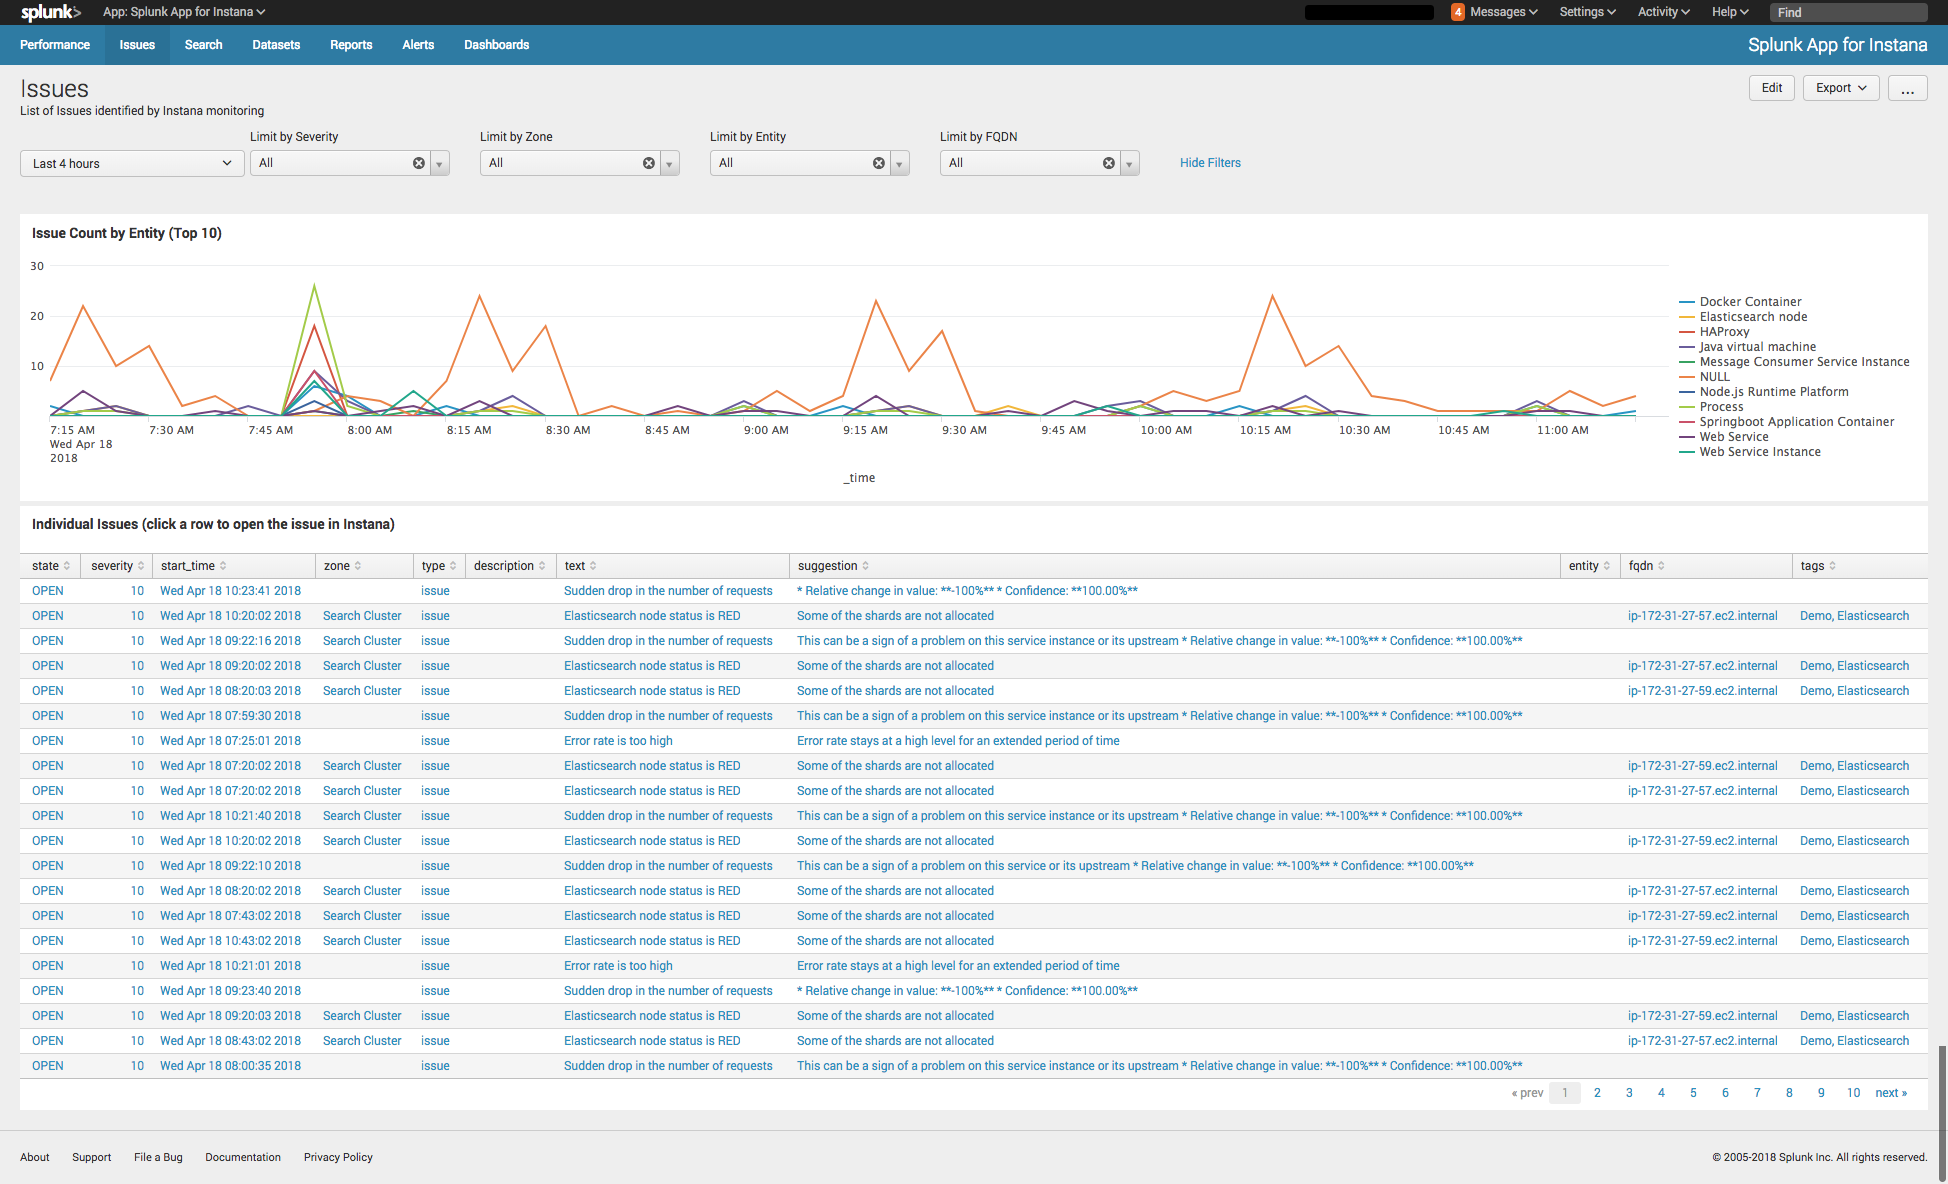
Splunk Integration with Instana
What's New?
- This Integration is now being maintained by Evgeni Wachnowezki of Instana! (evgeni.wachnowezki@instana.com)
- This updated version utilizes the latest Instana APIs to collect metrics and ingest them into Splunk.
- The Issues data collection has not yet been migrated over, but that will come in a subsequent release.
What's Needed?
-
Downloads
- Instana Add-on for Splunk
- Instana App for Splunk
-
Instana Information Required
- Instana API tenanat URL (https://<your account>.instana.io)
- Instana API Authorization Token
-
Splunk HTTP Event Collector (HEC) Token
- Splunk HEC URL (https://<Your_Splunk_Server>:8088/services/collector)
- Splunk HEC Token
Instana Performance Metrics Configuration
Installation
The installation consists of installing both the Instana Add-on for Splunk and the Instana App for Splunk.
- The Add-on is responsible for executing the rest API calls and collecting the data from Instana.
- The App provides a collection of dashboards and saved searches.
To install, navigate to Apps --> Manage Apps and select the “Install app from File” button. Specify the location of the file you downloaded and install it.
Configuration
The Instana Add-on for Splunk contains a global configuration for your Instana account URL and API authorization token.
Enter those values on the Configuration tab in the Add-on. You will find the settings in the Add-On Settings tab.
Next, create a new Input for the data you wish to collect via the Inputs menu -> Create New Input option. Each Input requires 4 parameters:
- Input Name
- Pollling interval
- Splunk Index to use
- Instana search filter that you would like to run (you can copy this directly from Instana's search bar)
To retrieve metrics for all web applications and websites use this filter:
entity.pluginId:logicalwebapp OR entity.pluginId:browserLogicalService
To retrieve metrics for all databases:
entity.selfType:database
Note: This Add-on can be used for entities (Instana Snapshots) that contains the following 4 metrics:
- latency ==> Average Response Time
- count ==> Calls per second
- error_rate ==> Error Rate
- instances ==> number of instances running this entity
Start Searching
Once the Instana Add-on for Splunk is installed and configured you can execute searches using:
sourcetype="instana:metrics"
Sending Instana Issues to Splunk
Instana automatically monitors for "Issues" within your monitored environment. To have Instana send Splunk Notifications when Issues are triggered, you will setup 2 components; a Splunk HEC Token and an Instana Alerting Integration for Splunk.
Splunk HTTP Event Collector (HEC) Token
- In Splunk, navigate to Settings --> HTTP Event Collector and create a "New Token". Note the token value as you'll need to use that in the Instana Alerting Integration.
Instana Alerting Integration for Splunk
- In Instana, configure an "Integration" in your user "Settings". You can find this in your User Account in the upper right corner of the website. Follow the menus from Settings --> Alerting --> Integration then click on the Splunk button. Once here enter the URL for your Splunk server (https://<Your_Splunk_Server>:8088/services/collector) and the Splunk HEC token you created above.
- To configure which events are sent to Splunk go to Settings --> Alerting --> Configurations and select the event types and optionally define a filter, then select the Splunk integration.
Now, when Instana triggers an issue, it will be automatically sent to Splunk!
Start Searching
Start Searching using:
sourcetype="instana:issues"

