Rdistance analyzes line- and point-transect distance-sampling data. If you are unfamiliar with distance-sampling, check out our primer, Distance Sampling for the Average Joe. For those ready to take on an analysis, the best place to start is one of our vignettes or in the Examples section (below).
Vignettes:
- Line-transect and point-transects
- Likelihood functions:
- half-normal (
halfnorm) - hazard rate (
hazrate) - negative exponential (
negexp) - Gamma (
Gamma) - logistic (
logistic)
- half-normal (
- Non-parametric smoothed distance functions (
smu) - Built-in key functions:
sine,cosine, andhermite - Expansion terms
- Standard methods:
print,plot,predict,AIC, etc. - Observation and transect-level distance function covariates
- Standard R formula model specification (e.g.,
distance ~ elevation + observer) - Measurement unit control and automatic conversion
- Automated bootstrap confidence intervals
- Overall (study area) abundance estimates
- Custom (user-defined) detection functions
- Help and vignettes reviewed and edited by multiple authors
The current release is here.
Install the development version from GitHub with:
if( !require("devtools") ){
  install.packages("devtools")
}
devtools::install_github("tmcd82070/Rdistance")
Install the stable version directly from CRAN:
install.packages("Rdistance")These examples show basic estimation of abundance via distance-sampling analyses, both with and without covariates. Additional information can be found on our wiki and in our vignettes.
if( !require("units") ){
  install.packages("units")
}
#> Loading required package: units
#> udunits database from C:/Users/trent/AppData/Local/R/win-library/4.2/units/share/udunits/udunits2.xml
library(Rdistance)
#> Rdistance (version 3.0.1)
library(units)

# Example data
data("sparrowDetectionData")  # access example data
data("sparrowSiteData")
head(sparrowDetectionData)  # inspect data
#>   siteID groupsize sightdist sightangle     dist
#> 1     A1         1        65         15 16.8 [m]
#> 2     A1         1        70         10 12.2 [m]
#> 3     A1         1        25         75 24.1 [m]
#> 4     A1         1        40          5  3.5 [m]
#> 5     A1         1        70         85 69.7 [m]
#> 6     A1         1        10         90 10.0 [m]
head(sparrowSiteData)
#>   siteID  length observer bare herb shrub height shrubclass
#> 1     A1 500 [m]     obs4 36.7 15.9  20.1   26.4       High
#> 2     A2 500 [m]     obs4 38.7 16.1  19.3   25.0       High
#> 3     A3 500 [m]     obs5 37.7 18.8  19.8   27.0       High
#> 4     A4 500 [m]     obs5 37.7 17.9  19.9   27.1       High
#> 5     B1 500 [m]     obs3 58.5 17.6   5.2   19.6        Low
#> 6     B2 500 [m]     obs3 56.6 18.1   5.2   19.0        Low
# Set upper (right) truncation distance
whi <- set_units(150, "m")
# Fit hazard rate likelihood
dfuncFit <- dfuncEstim(dist ~ 1
, detectionData = sparrowDetectionData
, likelihood = "hazrate"
, w.hi = whi)
dfuncFit <- abundEstim(dfuncFit
, detectionData = sparrowDetectionData
, siteData = sparrowSiteData
, area = set_units(2500, "hectares"))
#> Computing bootstrap confidence interval on N...
#> | | | 0% | | | 1% | |= | 1% | |= | 2% | |== | 2% | |== | 3% | |=== | 4% | |=== | 5% | |==== | 5% | |==== | 6% | |===== | 7% | |===== | 8% | |====== | 8% | |====== | 9% | |======= | 9% | |======= | 10% | |======= | 11% | |======== | 11% | |======== | 12% | |========= | 12% | |========= | 13% | |========== | 14% | |========== | 15% | |=========== | 15% | |=========== | 16% | |============ | 16% | |============ | 17% | |============ | 18% | |============= | 18% | |============= | 19% | |============== | 19% | |============== | 20% | |============== | 21% | |=============== | 21% | |=============== | 22% | |================ | 22% | |================ | 23% | |================= | 24% | |================= | 25% | |================== | 25% | |================== | 26% | |=================== | 26% | |=================== | 27% | |=================== | 28% | |==================== | 28% | |==================== | 29% | |===================== | 29% | |===================== | 30% | |===================== | 31% | |====================== | 31% | |====================== | 32% | |======================= | 32% | |======================= | 33% | |======================== | 34% | |======================== | 35% | |========================= | 35% | |========================= | 36% | |========================== | 36% | |========================== | 37% | |========================== | 38% | |=========================== | 38% | |=========================== | 39% | |============================ | 39% | |============================ | 40% | |============================ | 41% | |============================= | 41% | |============================= | 42% | |============================== | 42% | |============================== | 43% | |=============================== | 44% | |=============================== | 45% | |================================ | 45% | |================================ | 46% | |================================= | 46% | |================================= | 47% | |================================= | 48% | |================================== | 48% | |================================== | 49% | |=================================== | 49% | |=================================== | 50% | |=================================== | 51% | |==================================== | 51% | |==================================== | 52% | |===================================== | 52% | |===================================== | 53% | |===================================== | 54% | |====================================== | 54% | |====================================== | 55% | |======================================= | 55% | |======================================= | 56% | |======================================== | 57% | |======================================== | 58% | |========================================= | 58% | |========================================= | 59% | |========================================== | 59% | |========================================== | 60% | |========================================== | 61% | |=========================================== | 61% | |=========================================== | 62% | |============================================ | 62% | |============================================ | 63% | |============================================ | 64% | |============================================= | 64% | |============================================= | 65% | |============================================== | 65% | |============================================== | 66% | |=============================================== | 67% | |=============================================== | 68% | |================================================ | 68% | |================================================ | 69% | |================================================= | 69% | |================================================= | 70% | |================================================= | 71% | |================================================== | 71% | |================================================== | 72% | |=================================================== | 72% | |=================================================== | 73% | |=================================================== | 74% | |==================================================== | 74% | |==================================================== | 75% | |===================================================== | 75% | |===================================================== | 76% | |====================================================== | 77% | |====================================================== | 78% | |======================================================= | 78% | |======================================================= | 79% | |======================================================== | 79% | |======================================================== | 80% | |======================================================== | 81% | |========================================================= | 81% | |========================================================= | 82% | |========================================================== | 82% | |========================================================== | 83% | |========================================================== | 84% | |=========================================================== | 84% | |=========================================================== | 85% | |============================================================ | 85% | |============================================================ | 86% | |============================================================= | 87% | |============================================================= | 88% | |============================================================== | 88% | |============================================================== | 89% | |=============================================================== | 89% | |=============================================================== | 90% | |=============================================================== | 91% | |================================================================ | 91% | |================================================================ | 92% | |================================================================= | 92% | |================================================================= | 93% | |================================================================== | 94% | |================================================================== | 95% | |=================================================================== | 95% | |=================================================================== | 96% | |==================================================================== | 97% | |==================================================================== | 98% | |===================================================================== | 98% | |===================================================================== | 99% | |======================================================================| 99% | |======================================================================| 100%
summary(dfuncFit)
#> Call: dfuncEstim(formula = dist ~ 1, detectionData =
#> sparrowDetectionData, likelihood = "hazrate", w.hi = whi)
#> Coefficients:
#> Estimate SE z p(>|z|)
#> Sigma 43.584314 4.7041265 9.265124 1.948512e-20
#> k 2.405927 0.3096911 7.768797 7.923512e-15
#>
#> Convergence: Success
#> Function: HAZRATE
#> Strip: 0 [m] to 150 [m]
#> Effective strip width (ESW): 61.11514 [m]
#> 95% CI: 48.65994 [m] to 71.51501 [m]
#> Probability of detection: 0.4074342
#> Scaling: g(0 [m]) = 1
#> Negative log likelihood: 1631.795
#> AICc: 3267.625
#>
#> Surveyed Units: 36000 [m]
#> Individuals seen: 353 in 353 groups
#> Average group size: 1
#> Range: 1 to 1
#>
#> Density in sampled area: 8.022199e-05 [1/m^2]
#> 95% CI: 5.864192e-05 [1/m^2] to 0.0001061663 [1/m^2]
#>
#> Abundance in 2.5e+07 [m^2] study area: 2005.55
#> 95% CI: 1466.048 to 2654.158
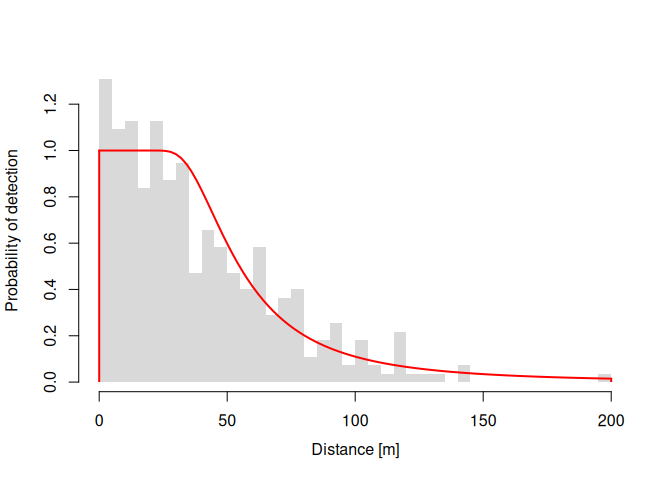
plot(dfuncFit)dfuncFit <- dfuncEstim(dist ~ bare
, detectionData = sparrowDetectionData
, siteData = sparrowSiteData
, likelihood = "hazrate"
, w.hi = whi)
dfuncFit <- abundEstim(dfuncFit
, detectionData = sparrowDetectionData
, siteData = sparrowSiteData
, area = set_units(2500, "hectares")
, ci=NULL)
summary(dfuncFit)
#> Call: dfuncEstim(formula = dist ~ bare, detectionData =
#> sparrowDetectionData, siteData = sparrowSiteData, likelihood =
#> "hazrate", w.hi = whi)
#> Coefficients:
#> Estimate SE z p(>|z|)
#> (Intercept) 3.06257745 0.27481293 11.144226 7.640549e-29
#> bare 0.01324778 0.00423315 3.129532 1.750852e-03
#> k 2.54796690 0.34648791 7.353696 1.927993e-13
#>
#> Convergence: Success
#> Function: HAZRATE
#> Strip: 0 [m] to 150 [m]
#> Average effective strip width (ESW): 62.78704 [m]
#> Average probability of detection: 0.4185803
#> Scaling: g(0 [m]) = 1
#> Negative log likelihood: 1626.919
#> AICc: 3259.908
#>
#> Surveyed Units: 36000 [m]
#> Individuals seen: 353 in 353 groups
#> Average group size: 1
#> Range: 1 to 1
#> Density in sampled area: 8.023675e-05 [1/m^2]
#> Abundance in 2.5e+07 [m^2] study area: 2005.919
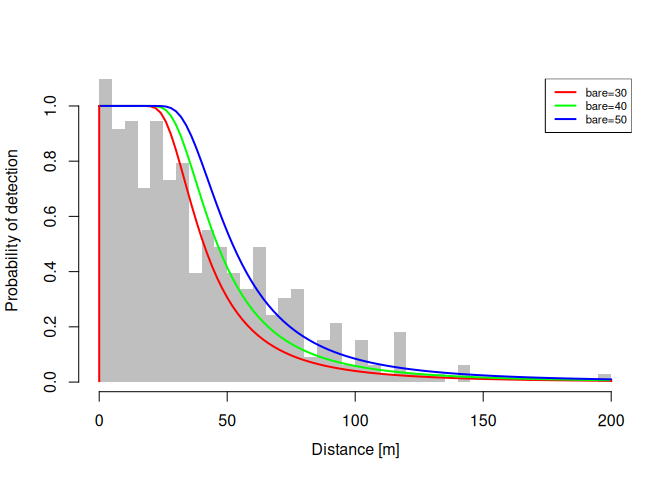
plot(dfuncFit, newdata = data.frame(bare = c(30, 40, 50)), lty = 1)# Example data
data("thrasherDetectionData") # access example data
data("thrasherSiteData")
head(thrasherDetectionData) # inspect example data
#> siteID groupsize dist
#> 1 C1X01 1 11 [m]
#> 2 C1X01 1 183 [m]
#> 3 C1X02 1 58 [m]
#> 4 C1X04 1 89 [m]
#> 5 C1X05 1 83 [m]
#> 6 C1X06 1 95 [m]
head(thrasherSiteData)
#> siteID observer bare herb shrub height
#> 1 C1X01 obs5 45.8 19.5 18.7 23.7
#> 2 C1X02 obs5 43.4 20.2 20.0 23.6
#> 3 C1X03 obs5 44.1 18.8 19.4 23.7
#> 4 C1X04 obs5 38.3 22.5 23.5 34.3
#> 5 C1X05 obs5 41.5 20.5 20.6 26.8
#> 6 C1X06 obs5 43.7 18.6 20.0 23.8dfuncFit <- dfuncEstim(dist ~ 1
, detectionData = thrasherDetectionData
, likelihood = "hazrate"
, pointSurvey = TRUE)
dfuncFit <- abundEstim(dfuncFit
, detectionData = thrasherDetectionData
, siteData = thrasherSiteData
, area = set_units(100, "acres"), ci=NULL)
summary(dfuncFit)
#> Call: dfuncEstim(formula = dist ~ 1, detectionData =
#> thrasherDetectionData, likelihood = "hazrate", pointSurvey = TRUE)
#> Coefficients:
#> Estimate SE z p(>|z|)
#> Sigma 93.729366 5.872255 15.96139 2.373773e-57
#> k 4.199498 0.397140 10.57435 3.918838e-26
#>
#> Convergence: Success
#> Function: HAZRATE
#> Strip: 0 [m] to 265 [m]
#> Effective detection radius (EDR): 118.6222 [m]
#> Probability of detection: 0.2003733
#> Scaling: g(0 [m]) = 1
#> Negative log likelihood: 999.0199
#> AICc: 2002.103
#>
#> Surveyed Units: 120
#> Individuals seen: 193 in 193 groups
#> Average group size: 1
#> Range: 1 to 1
#> Density in sampled area: 3.638267e-05 [1/m^2]
#> Abundance in 404687.3 [m^2] study area: 14.7236
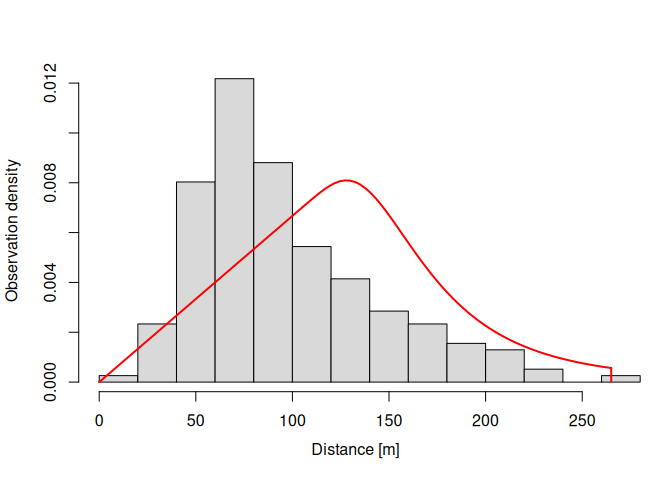
plot(dfuncFit)dfuncFit <- dfuncEstim(dist ~ bare + shrub
, detectionData = thrasherDetectionData
, siteData = thrasherSiteData
, likelihood = "hazrate"
, pointSurvey = TRUE)
dfuncFit <- abundEstim(dfuncFit
, detectionData = thrasherDetectionData
, siteData = thrasherSiteData
, area = set_units(100, "acres"), ci=NULL)
summary(dfuncFit)
#> Call: dfuncEstim(formula = dist ~ bare + shrub, detectionData =
#> thrasherDetectionData, siteData = thrasherSiteData, likelihood =
#> "hazrate", pointSurvey = TRUE)
#> Coefficients:
#> Estimate SE z p(>|z|)
#> (Intercept) 6.255906155 0.653609024 9.5713277 1.055415e-21
#> bare -0.002685066 0.008599183 -0.3122467 7.548531e-01
#> shrub -0.076016772 0.021062194 -3.6091574 3.071932e-04
#> k 4.412910399 0.437284958 10.0916126 6.017275e-24
#>
#> Convergence: Success
#> Function: HAZRATE
#> Strip: 0 [m] to 265 [m]
#> Average effective detection radius (EDR): 121.0046 [m]
#> Average probability of detection: 0.2114999
#> Scaling: g(0 [m]) = 1
#> Negative log likelihood: 994.7526
#> AICc: 1997.718
#>
#> Surveyed Units: 120
#> Individuals seen: 193 in 193 groups
#> Average group size: 1
#> Range: 1 to 1
#> Density in sampled area: 3.65881e-05 [1/m^2]
#> Abundance in 404687.3 [m^2] study area: 14.80674
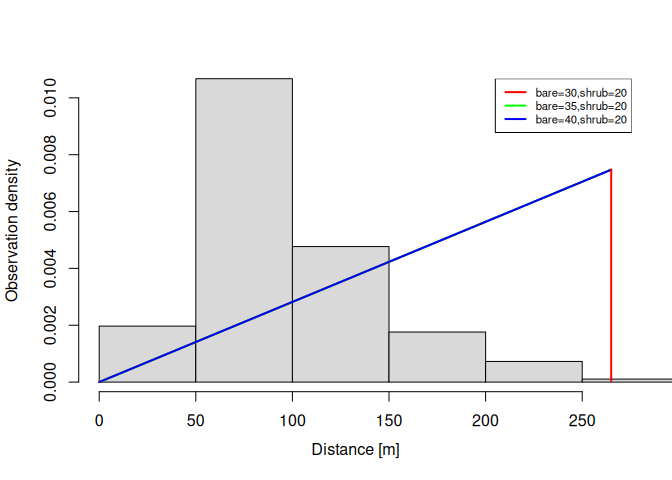
plot(dfuncFit, newdata = data.frame(bare = c(30, 35, 40)
, shrub = 20), lty = 1)See our NEWS file for recent changes.


