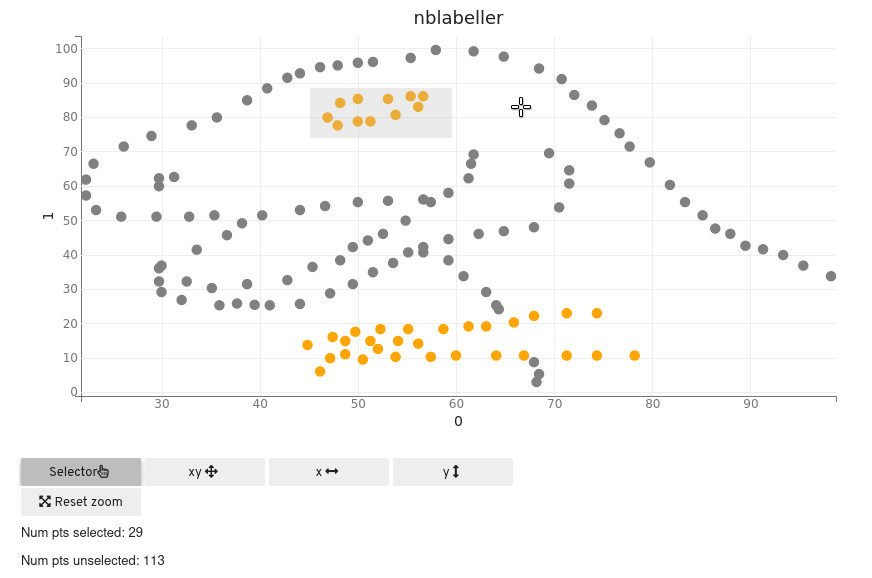
Label tabular data directly in Jupyter Notebook / Lab.
Scratching my own itch to have a tabular data labelling tool that fits within the established data science workflow, without having to export data to a separate annotation tool.
Disclaimer: early WIP, currently looks like this:
from nblabel import label

label(
    df, # The dataframe to use
    x_col="x", y_col="y", # Columns for x-axis and y-axis
    labels=["a", "b", "c"], # Specify what labels to use
    default_label="b", # Specify what default label to populate
    label_col_name="selected", # Column to store labels
    title="nblabeller" # Plot title
)
Save the df when you are done:
df.to_csv("nblabel-example-output.csv")Data source: Datasaurus by Alberto Cairo
On top of packages that you probably already have: pandas, numpy, traitlets (comes with Jupyter), nblabel depends on ipywidgets and bqplot.
- Install
ipywidgets, follow the installation instructions depending on which Jupyter you are using: https://ipywidgets.readthedocs.io/en/latest/user_install.html pip install git+https://github.com/tnwei/nblabel
Project based on the cookiecutter-datascience-lite template.
