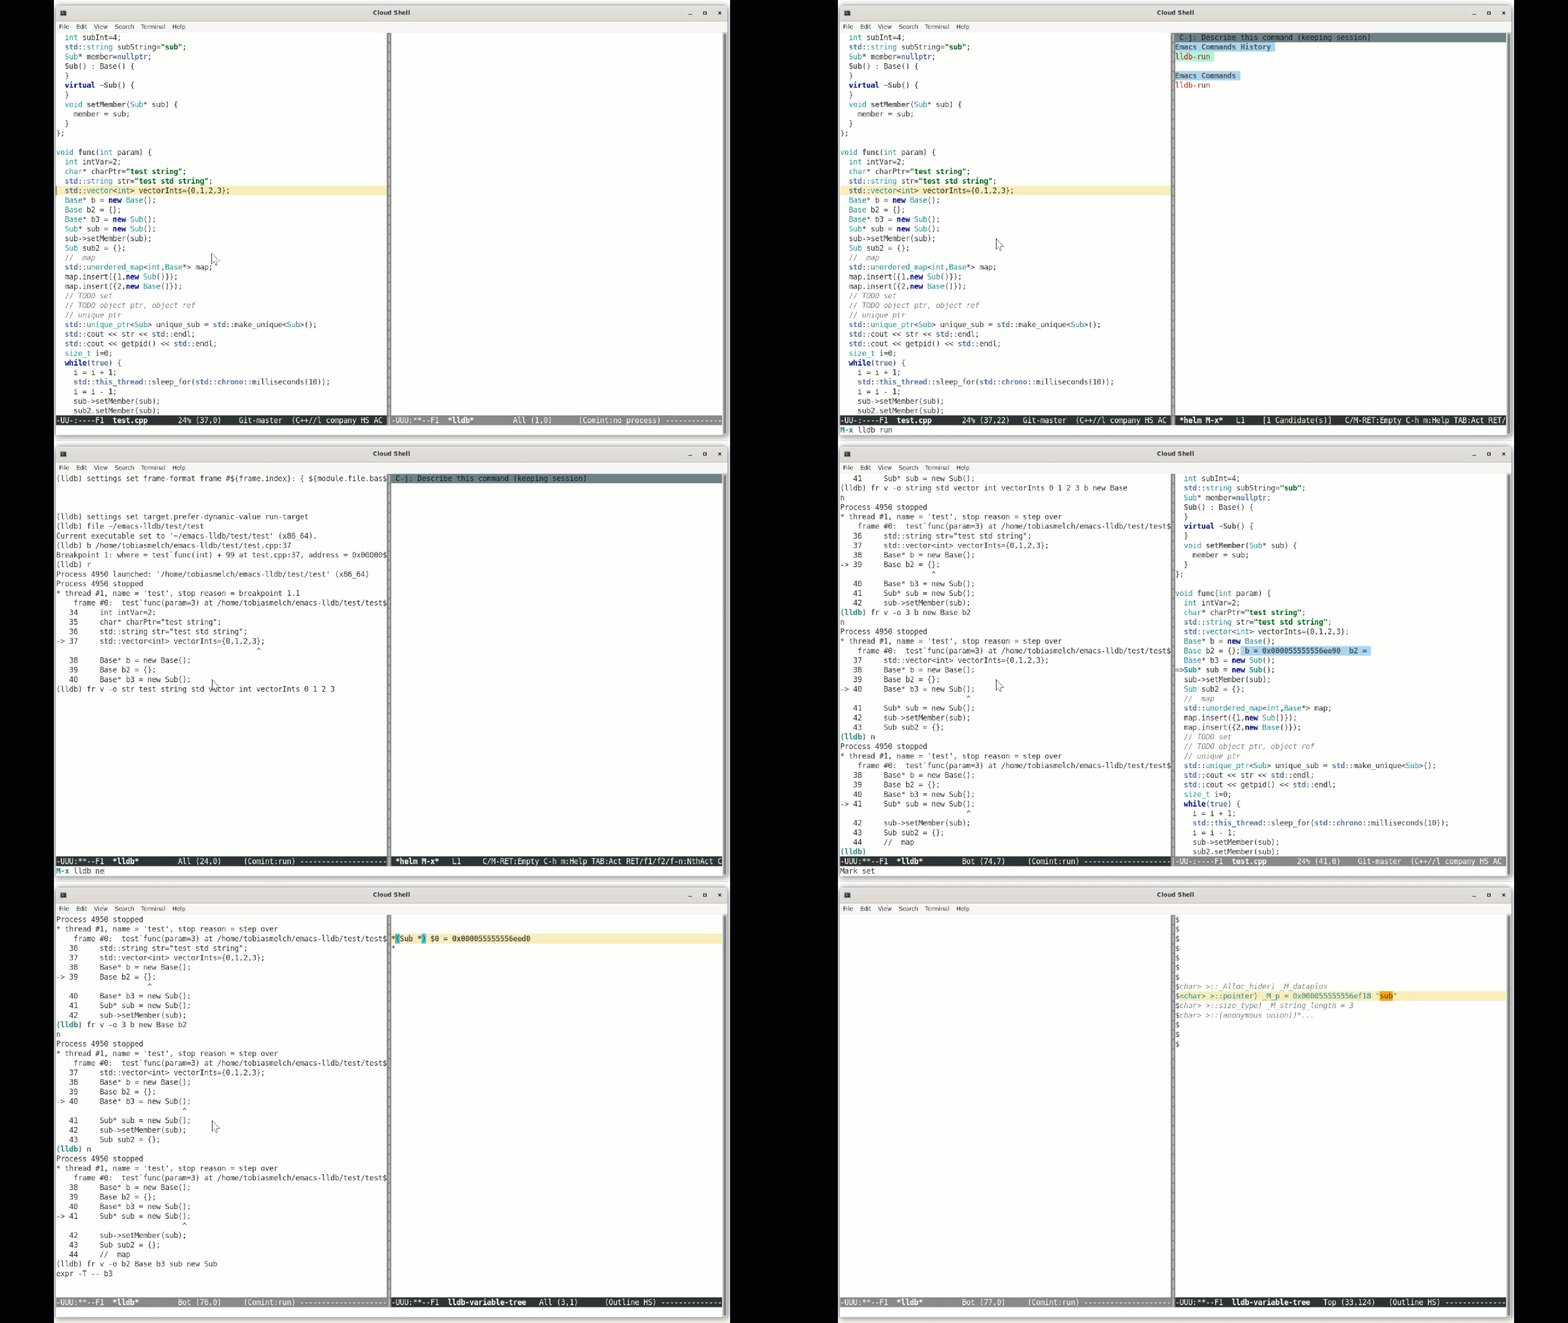
Simple emacs interface for lldb
Clone this git repository and load the lldb.el file via M-x load-file
M-x lldb-run start lldb process and debug the specified program via read-file-name
M-x lldb-attach start lldb process and attach to a running process
M-x lldb-set-breakpoint adds an entry to file ~/.breakpoints which will be used to set breakpoints when debugger is started
M-x lldb-catch-throw stop debugger when c++ exception is thrown (similar to gdbs catch throw)
M-x lldb-catch-catch stop debugger when exception is catched (similar to gdbs catch catch)
M-x lldb-list-breakpoints shows a simple buffer with all the breakpoints.
Inside the breakpoints buffer, following commands are provided:
M-x lldb-open-file-for-breakpoint
M-x lldb-delete-breakpoint
M-x lldb-step-into
M-x lldb-step-over
M-x lldb-step-out
M-x lldb-continue
M-x lldb-eval-variable evaluate given expression and show result in a tree structure via outline-mode
following commands are supported inside the variable result buffer:
M-x lldb-variable-expand
M-x lldb-variable-expand-2
M-x lldb-variable-plain-string
M-x lldb-backtrace shows the current backtrace (runs command bt)
M-x lldb-backtrace-find-file navigates to source location for current backtrace entry at current (point)
