- This project exploits the power of data analysis and machine learning to take business to the next level!
- It's one of the competiting projects in Data Science - Challenge Round 2 Hosted by Dr. Doaa Mahmoud.
- The project consist of 3 sections
- EDA and Interactive Dashboard by Power BI
- Predictive Analysis Model
- Association Rules
- General Analysis.
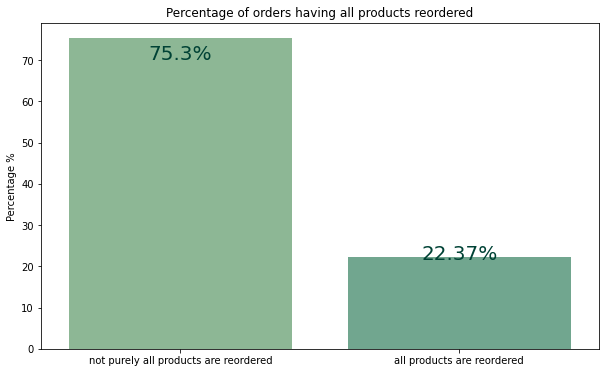
- Analyzing Behavour of users: users who always order same products.
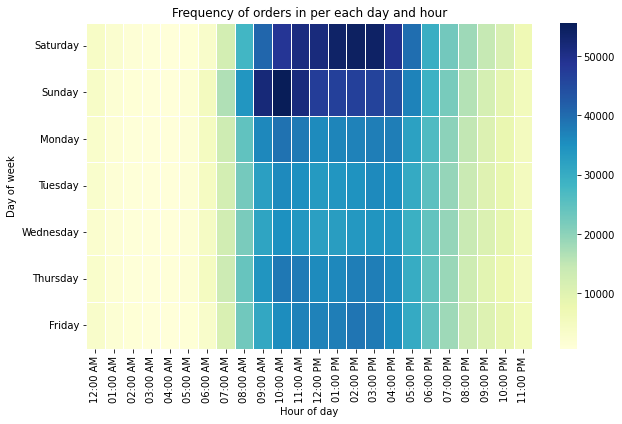
- How Time affects the purchasing behaviour of customers?
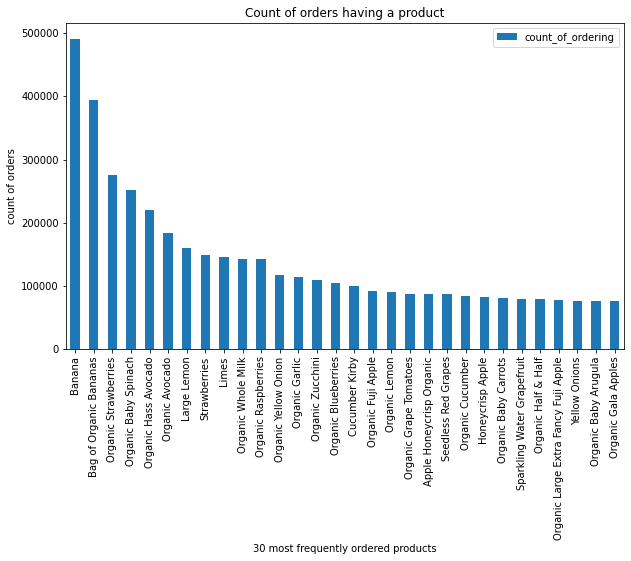
- Analyzing products
- Analyzing Organic Prodcuts.
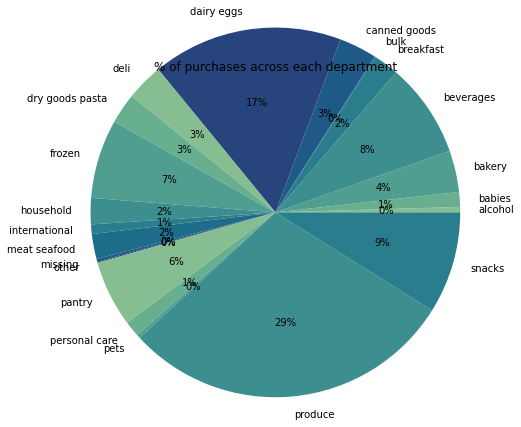
- Purchasing behaviour on Departments and Aisles.
|
|
|
|
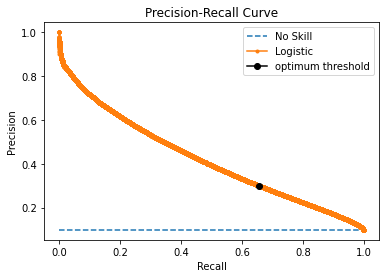
A predictive analysis model , that predicts the products ordered in users' future order based on each purchasing history. Primary Key is the user-product pair to predict whether will be in the future order or not.
XGBoost Classifier was used.
Features with highest importance used by the model:
- up_orders_since_last_order: measures how long the user hasn't considered buying a specific product.
- up_order_rate_since_first_time: measures the degree a user like a product. It's the ratio by which a user will buy a product from the first moment he/she knew about it.
- prod_reorder_ratio: measures how customers in general like a product.
- user_reorder_ratio: measures how this user is likely to buy something new!
- Data is sparse, we have very large number of products and of course the customer will have very few in his/her next order. Data is very skewed to the negative class. Class distribution: 90% negative class, 10% positive class.
- First, we've found that there's alot of false negatives, do We changed the threshold to maximize the recall, while keeping the precision above a certain threshold [0.3].
- In ther words, we wanted to reduce, the false negatives, the number of products the model say user won't predict in the future while he/she will actually does. On the other side, it's okay to allow some false positives, when the model recommends a products the user will less likely buy in his/her next order.
./
├── EDA
|     ├── eda-on-instacart-data.ipynb
|
├── Model
|     |
|     └── predictive-analysis-model.ipynb
└── Business Insights
      ├── Business Questions-Solutions.pdf
      └── Project-Data Description.pdf
- Applying dynamic thresholding on user's products according to his/her average basket size.
- Applying seperate prediction on strong behaviour users.
- Deploy the Model.
|
Toka Khaled |
Noran Hany |
