Telecommunication companies produce data extremely fast.
To make decisions based on this data, companies need to capture, transform, and analyze it in real time. They also need to store the data in an easy format for future use (AI model training etc).
But sometimes, this data is generated so quickly that it can overwhelm a traditional database. This is where Data Grid comes in. It's a in-memory cache that can accelerate our data processing and serve as a buffer between our data intake and the database.
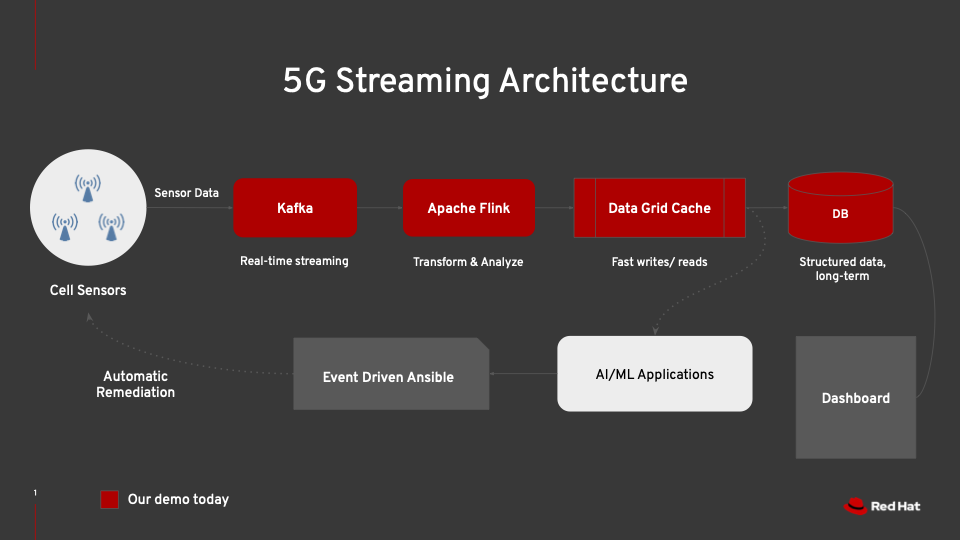
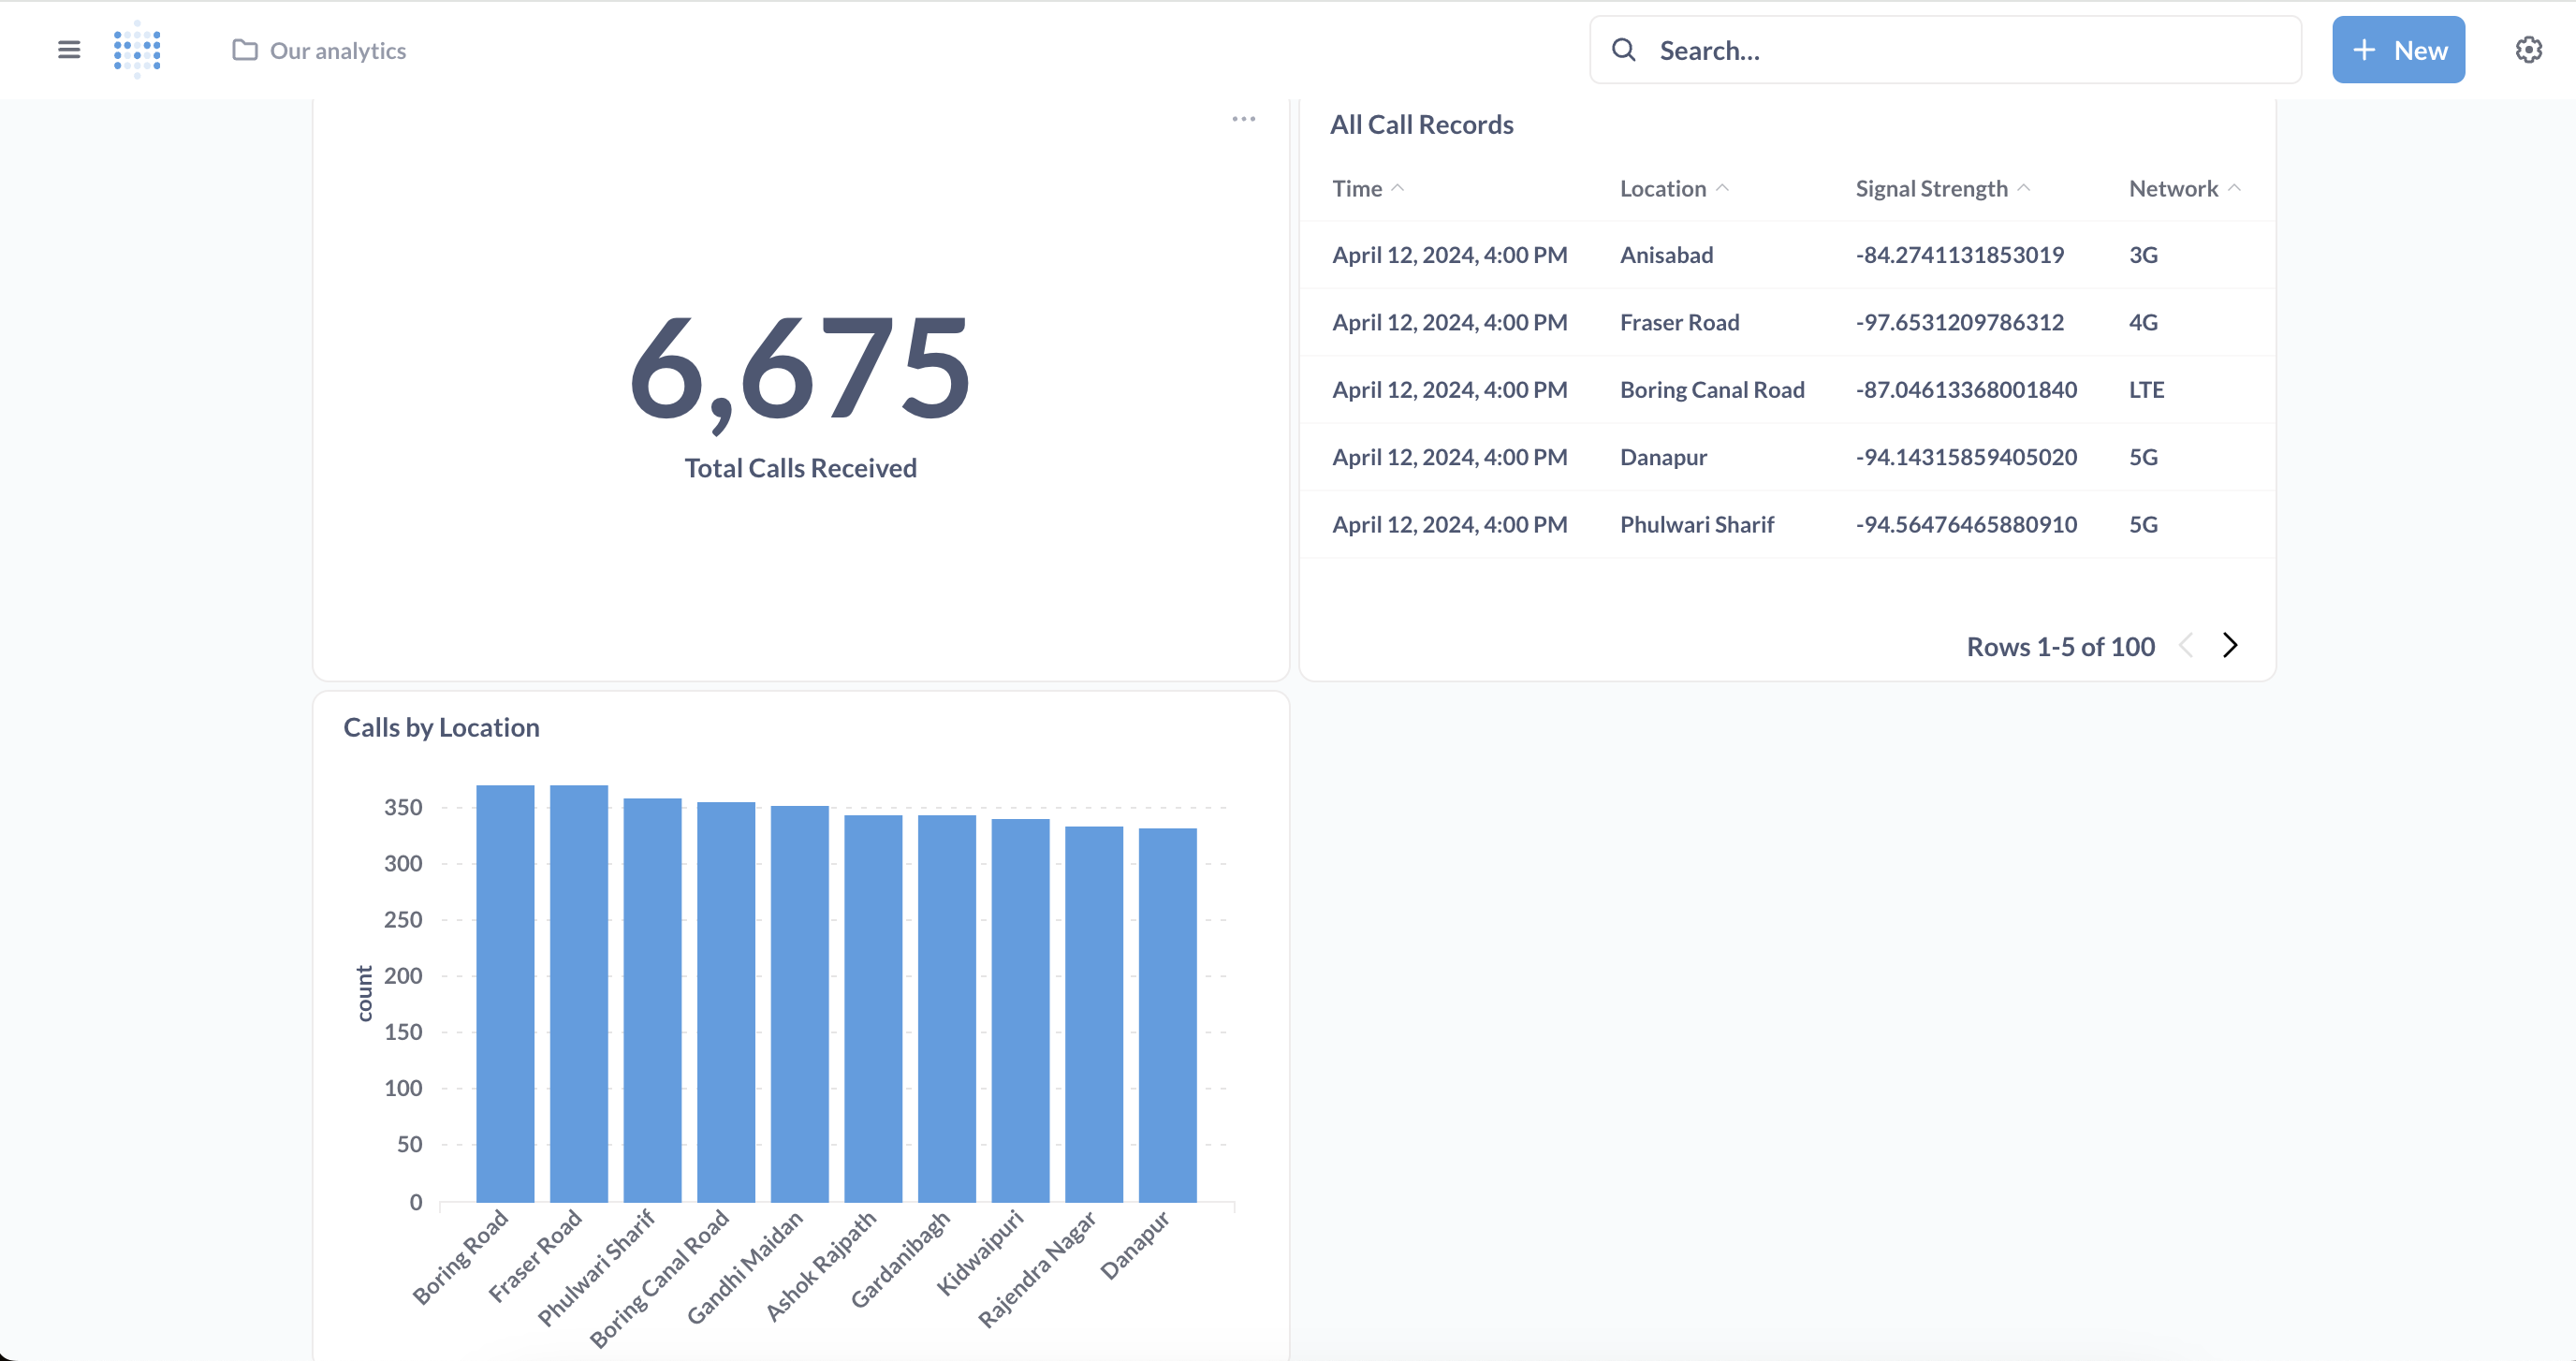
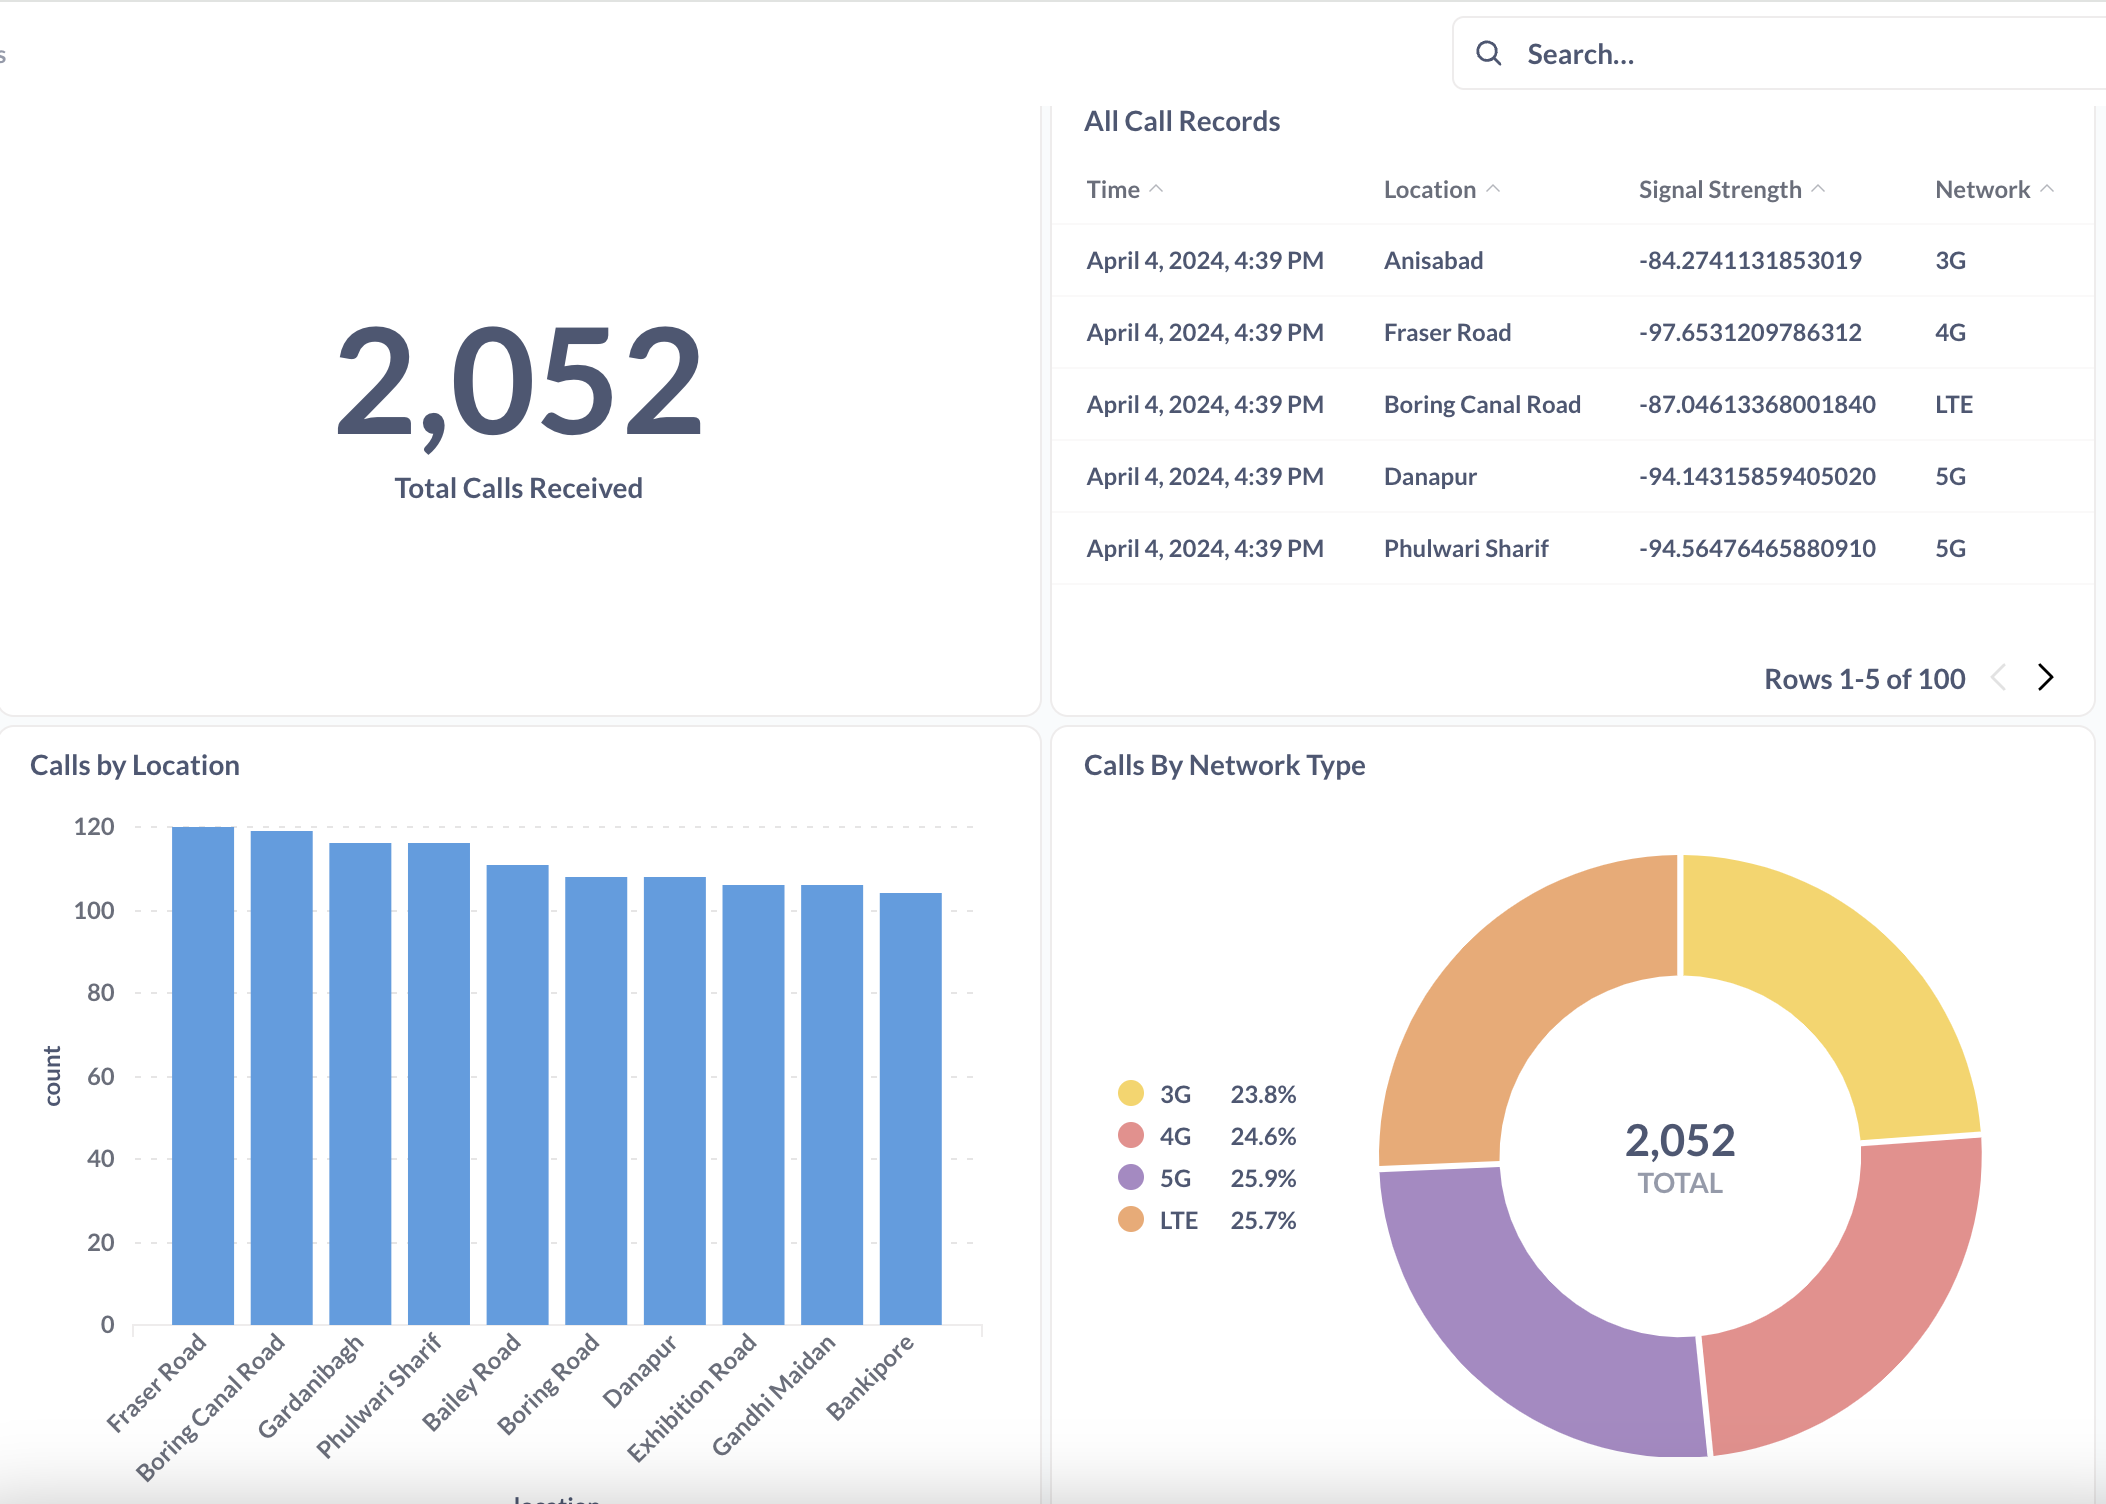
Our architecture will generate data from cell devices, transform it, and store it in our cache for fast operations. We’ll also hook up a dashboard to see cell tower data generated in real-time.
The architecture has five main parts.
- AMQ Streams (Kafka) - Handles high throughput real-time streaming
- Apache Flink - Transforms & analyzes call record data into usable format
- Data Grid - High throughput cache to serve as a buffer between Kafka and our database
- MySQL Database - Stores call record data for long term use
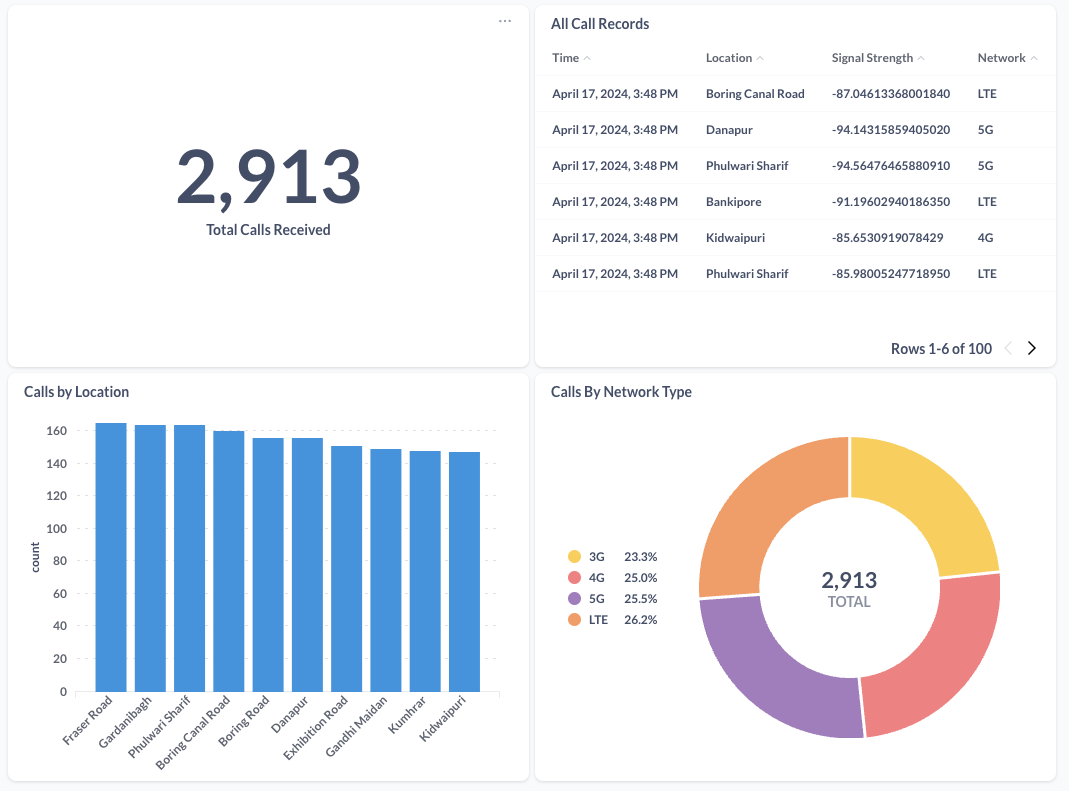
- Metabase Dashboard - Displays call record data
For a quick deployment, we can use an Ansible playbook to setup our architecture on OpenShift. Here's what you'll need on your local system.
- An openshift cluster with cluster admin priviledges
- Ansible (version 2.2 or higher)
- curl & oc libraries
First, login to the OpenShift API Server.
oc login -u <admin_username> -p <admin_password> <api_url>
Then, run the playbook.
ansible-playbook playbook.yml -i inventory
We’ll use AMQ Streams to handle events being generated from our cell devices.
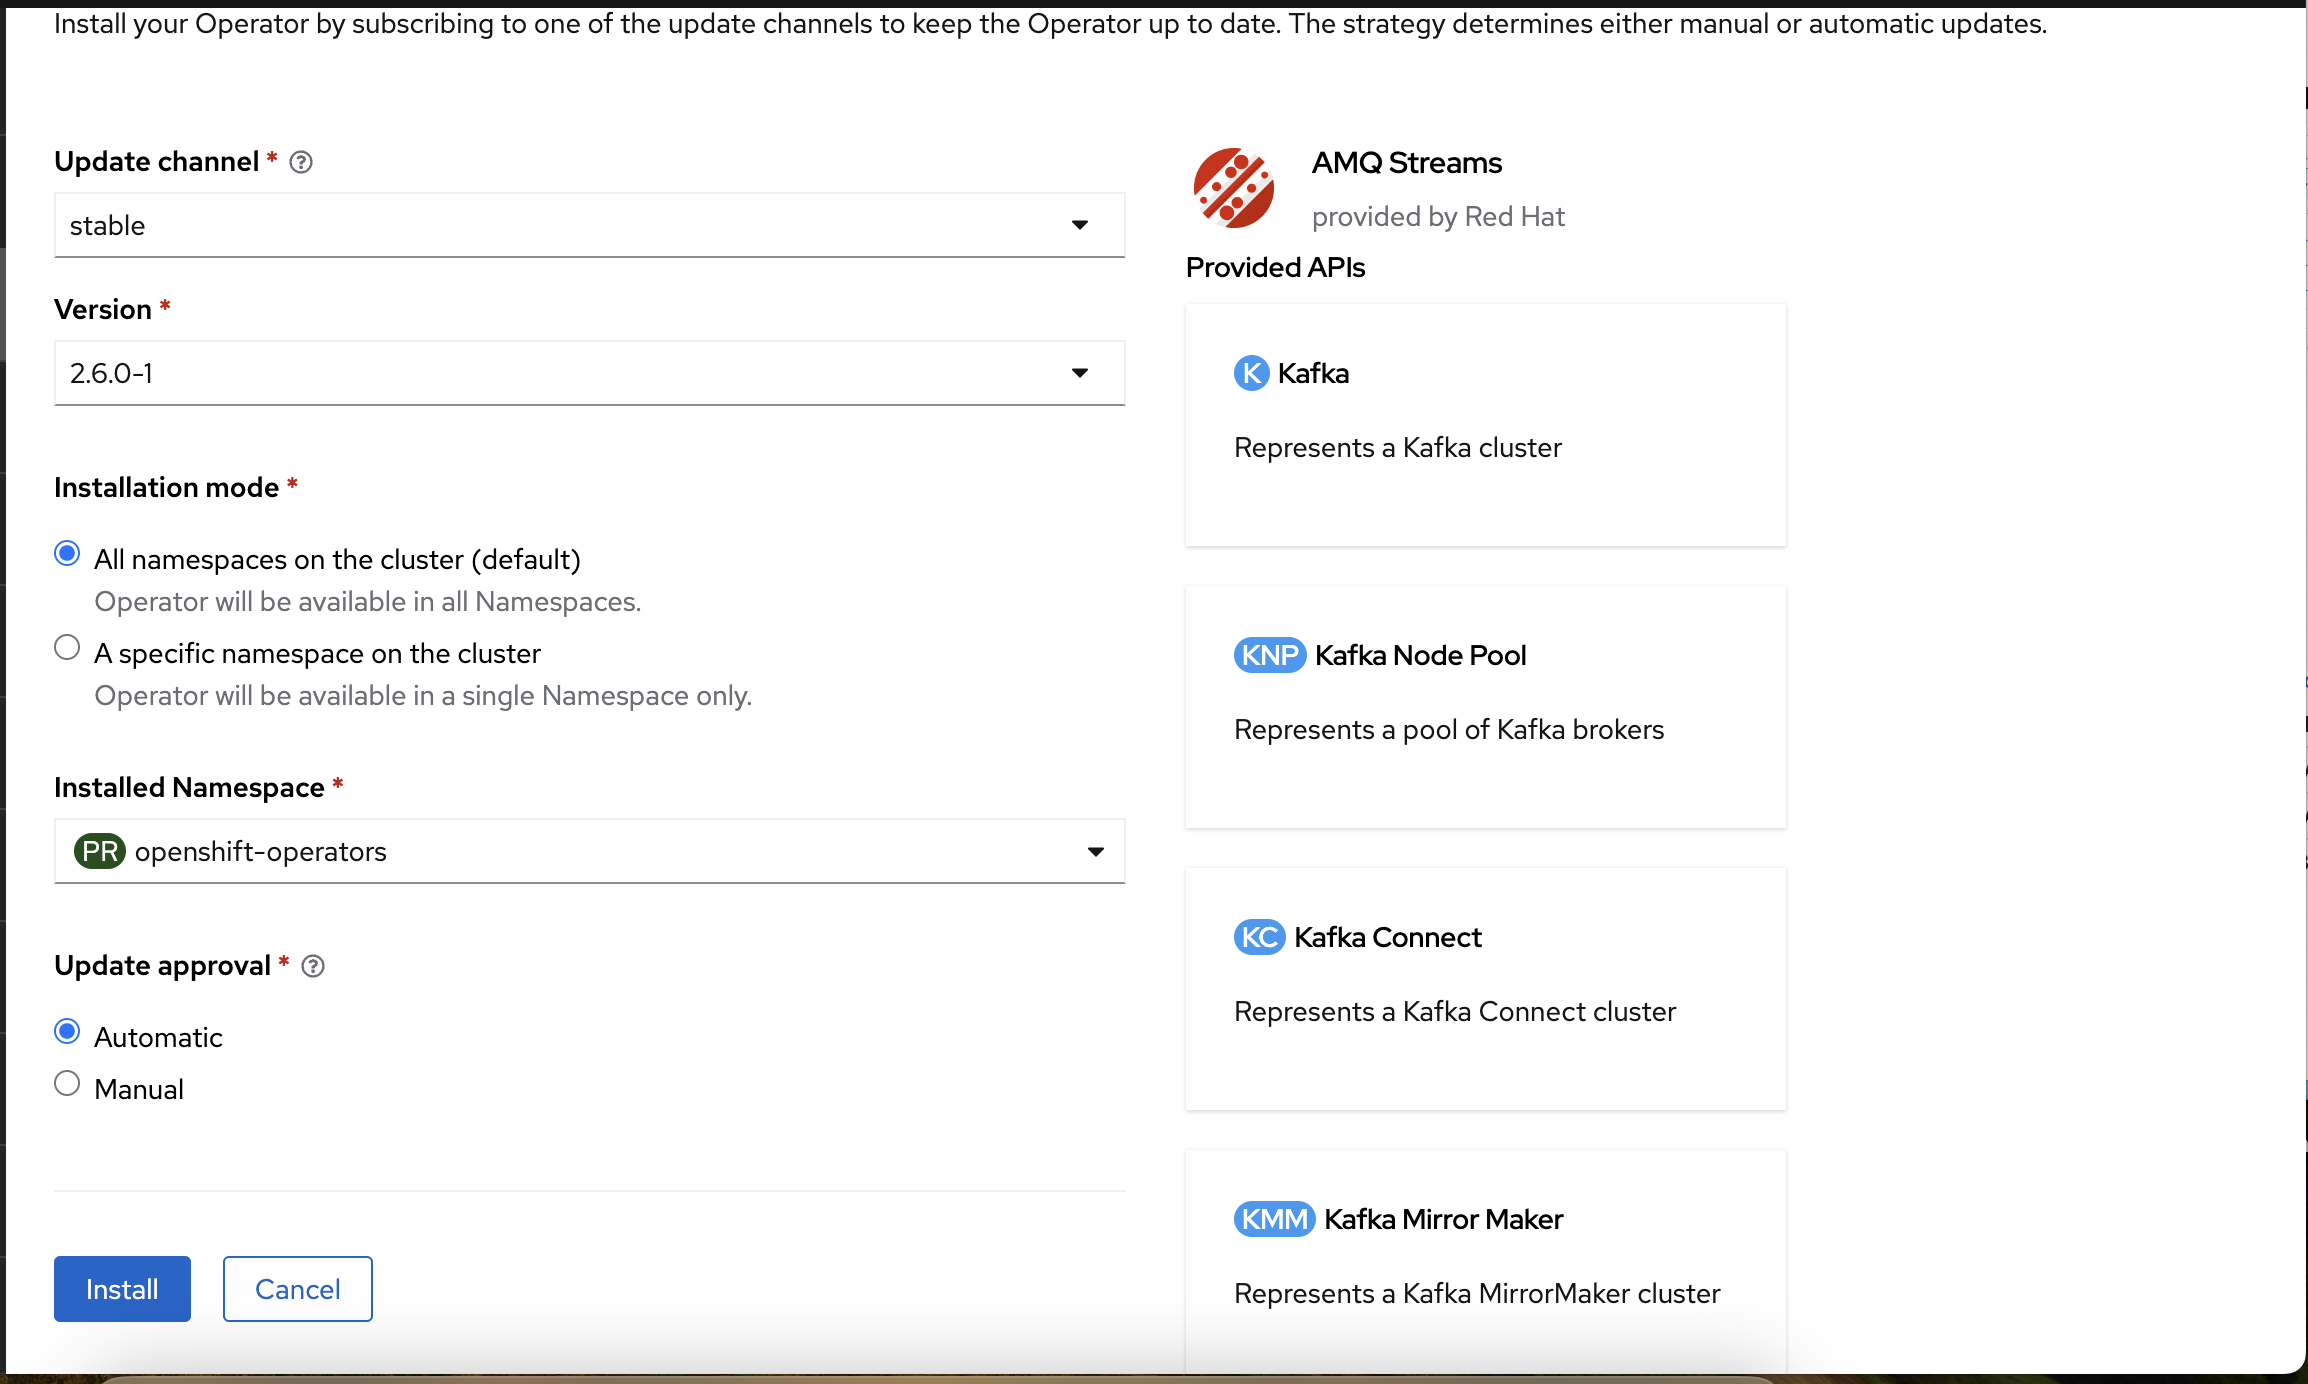
First, we’ll install the AMQ Streams Operator. On the left menu of the OpenShift console, select Operators → OperatorHub and type AMQ Streams. Click Install. Make sure the Installed Namespace is openshift-operators. Click Install again.
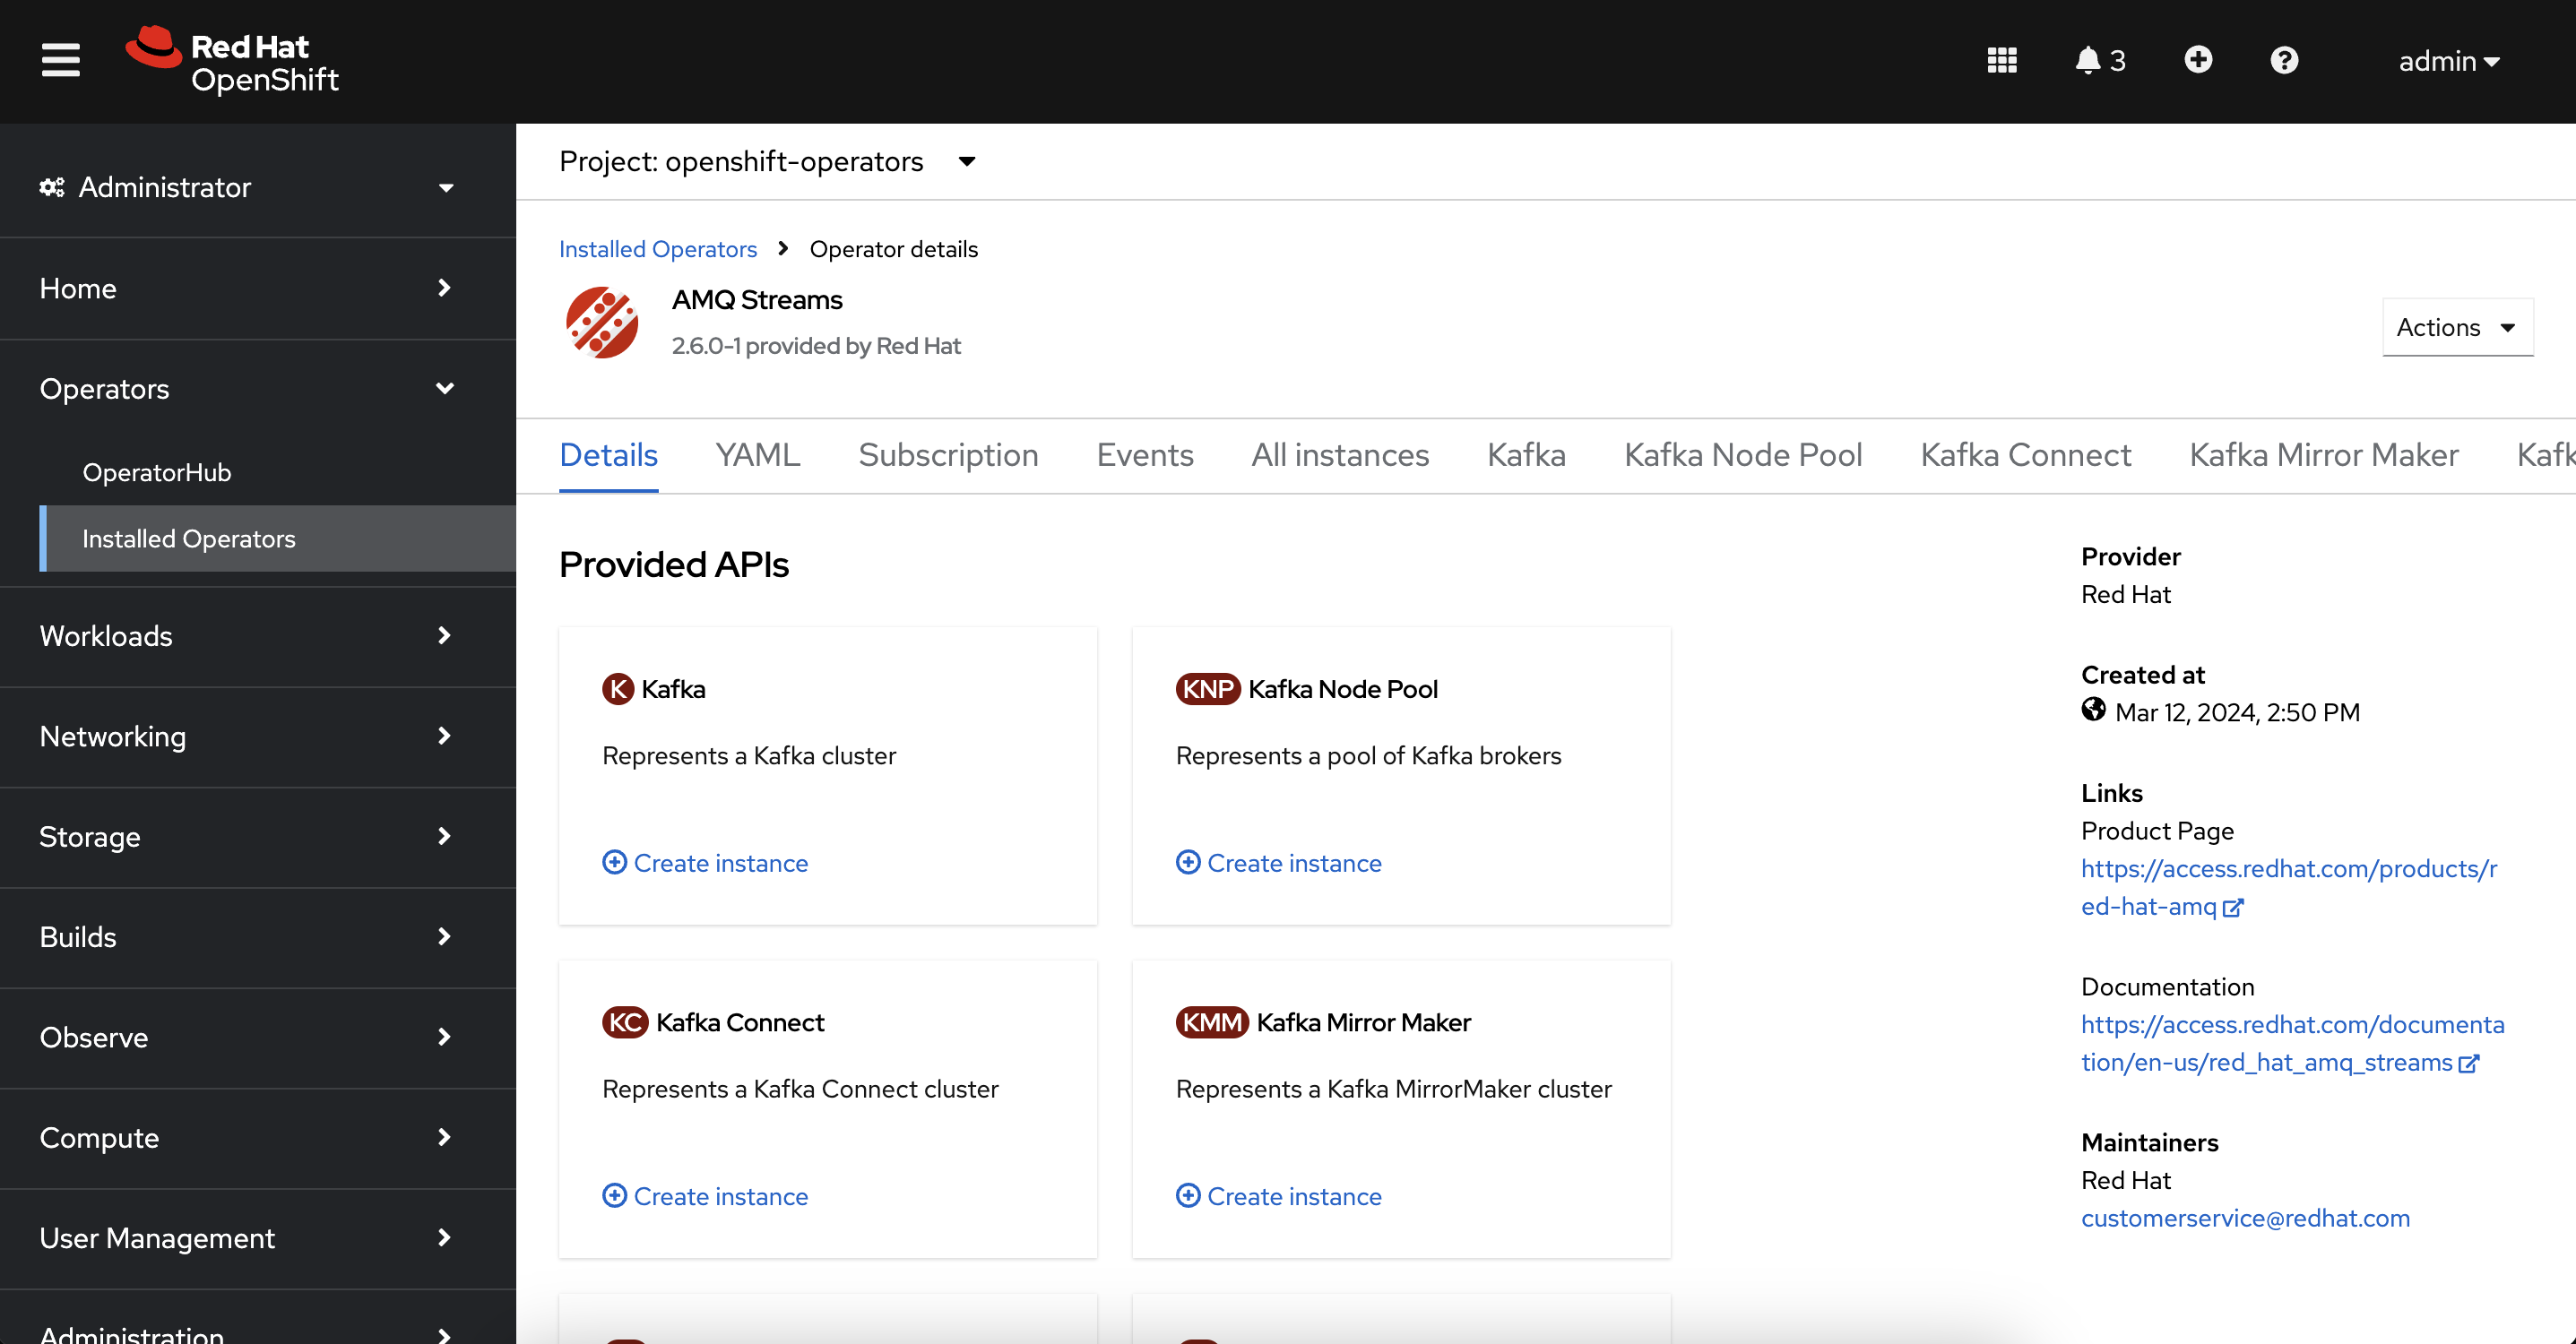
After the operator finishes installing, we’ll create a new Kafka cluster. On the left menu, select Operators → Installed Operators and click “AMQ Streams”. Under “Provided APIs”, create an instance of Kafka. Name the cluster my-cluster and use the default settings. Click Create.
Finally, we’ll create a topic to stream our call events. In the horizontal menu, select Kafka Topic. Click Create Kafka Topic and name the topic call-records.
We’ll use data grid to cache our call events for quick access. Data Grid is a distributed, in-memory cache that accelerates data processing.
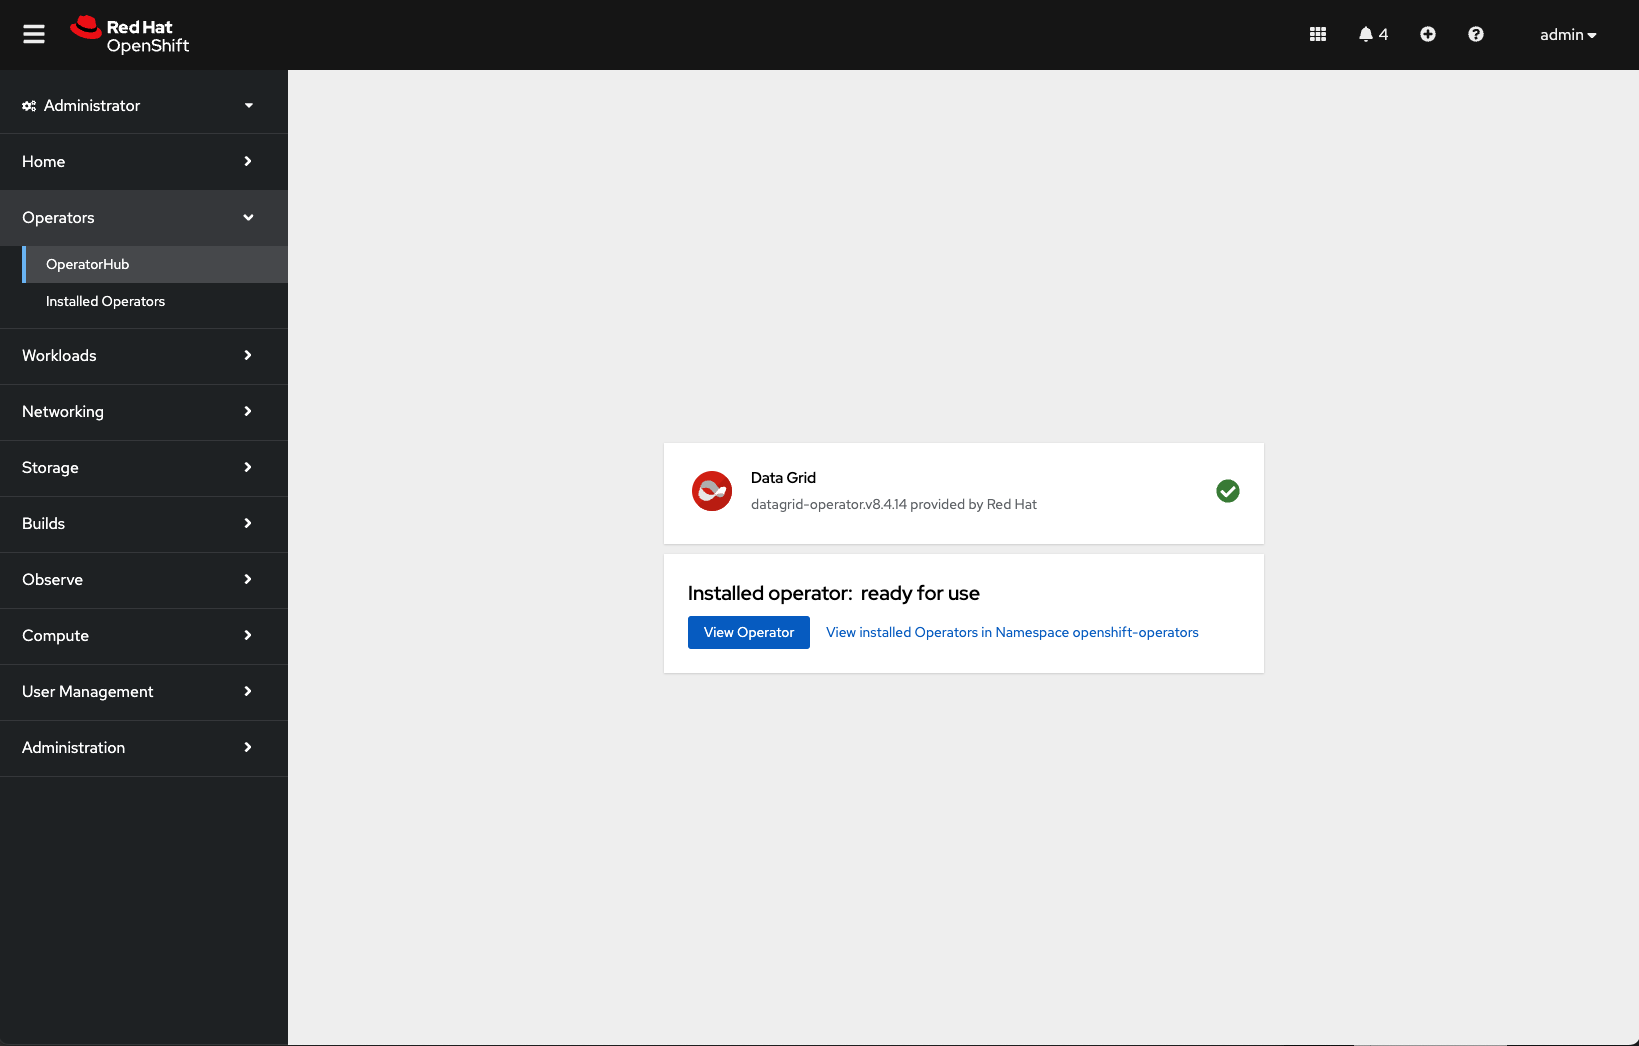
First, we’ll install the Data Grid Operator. On the left menu, select Operators → OperatorHub and type Data Grid. Click Install. The Installed Namespace should be openshift-operators. Click Install again.
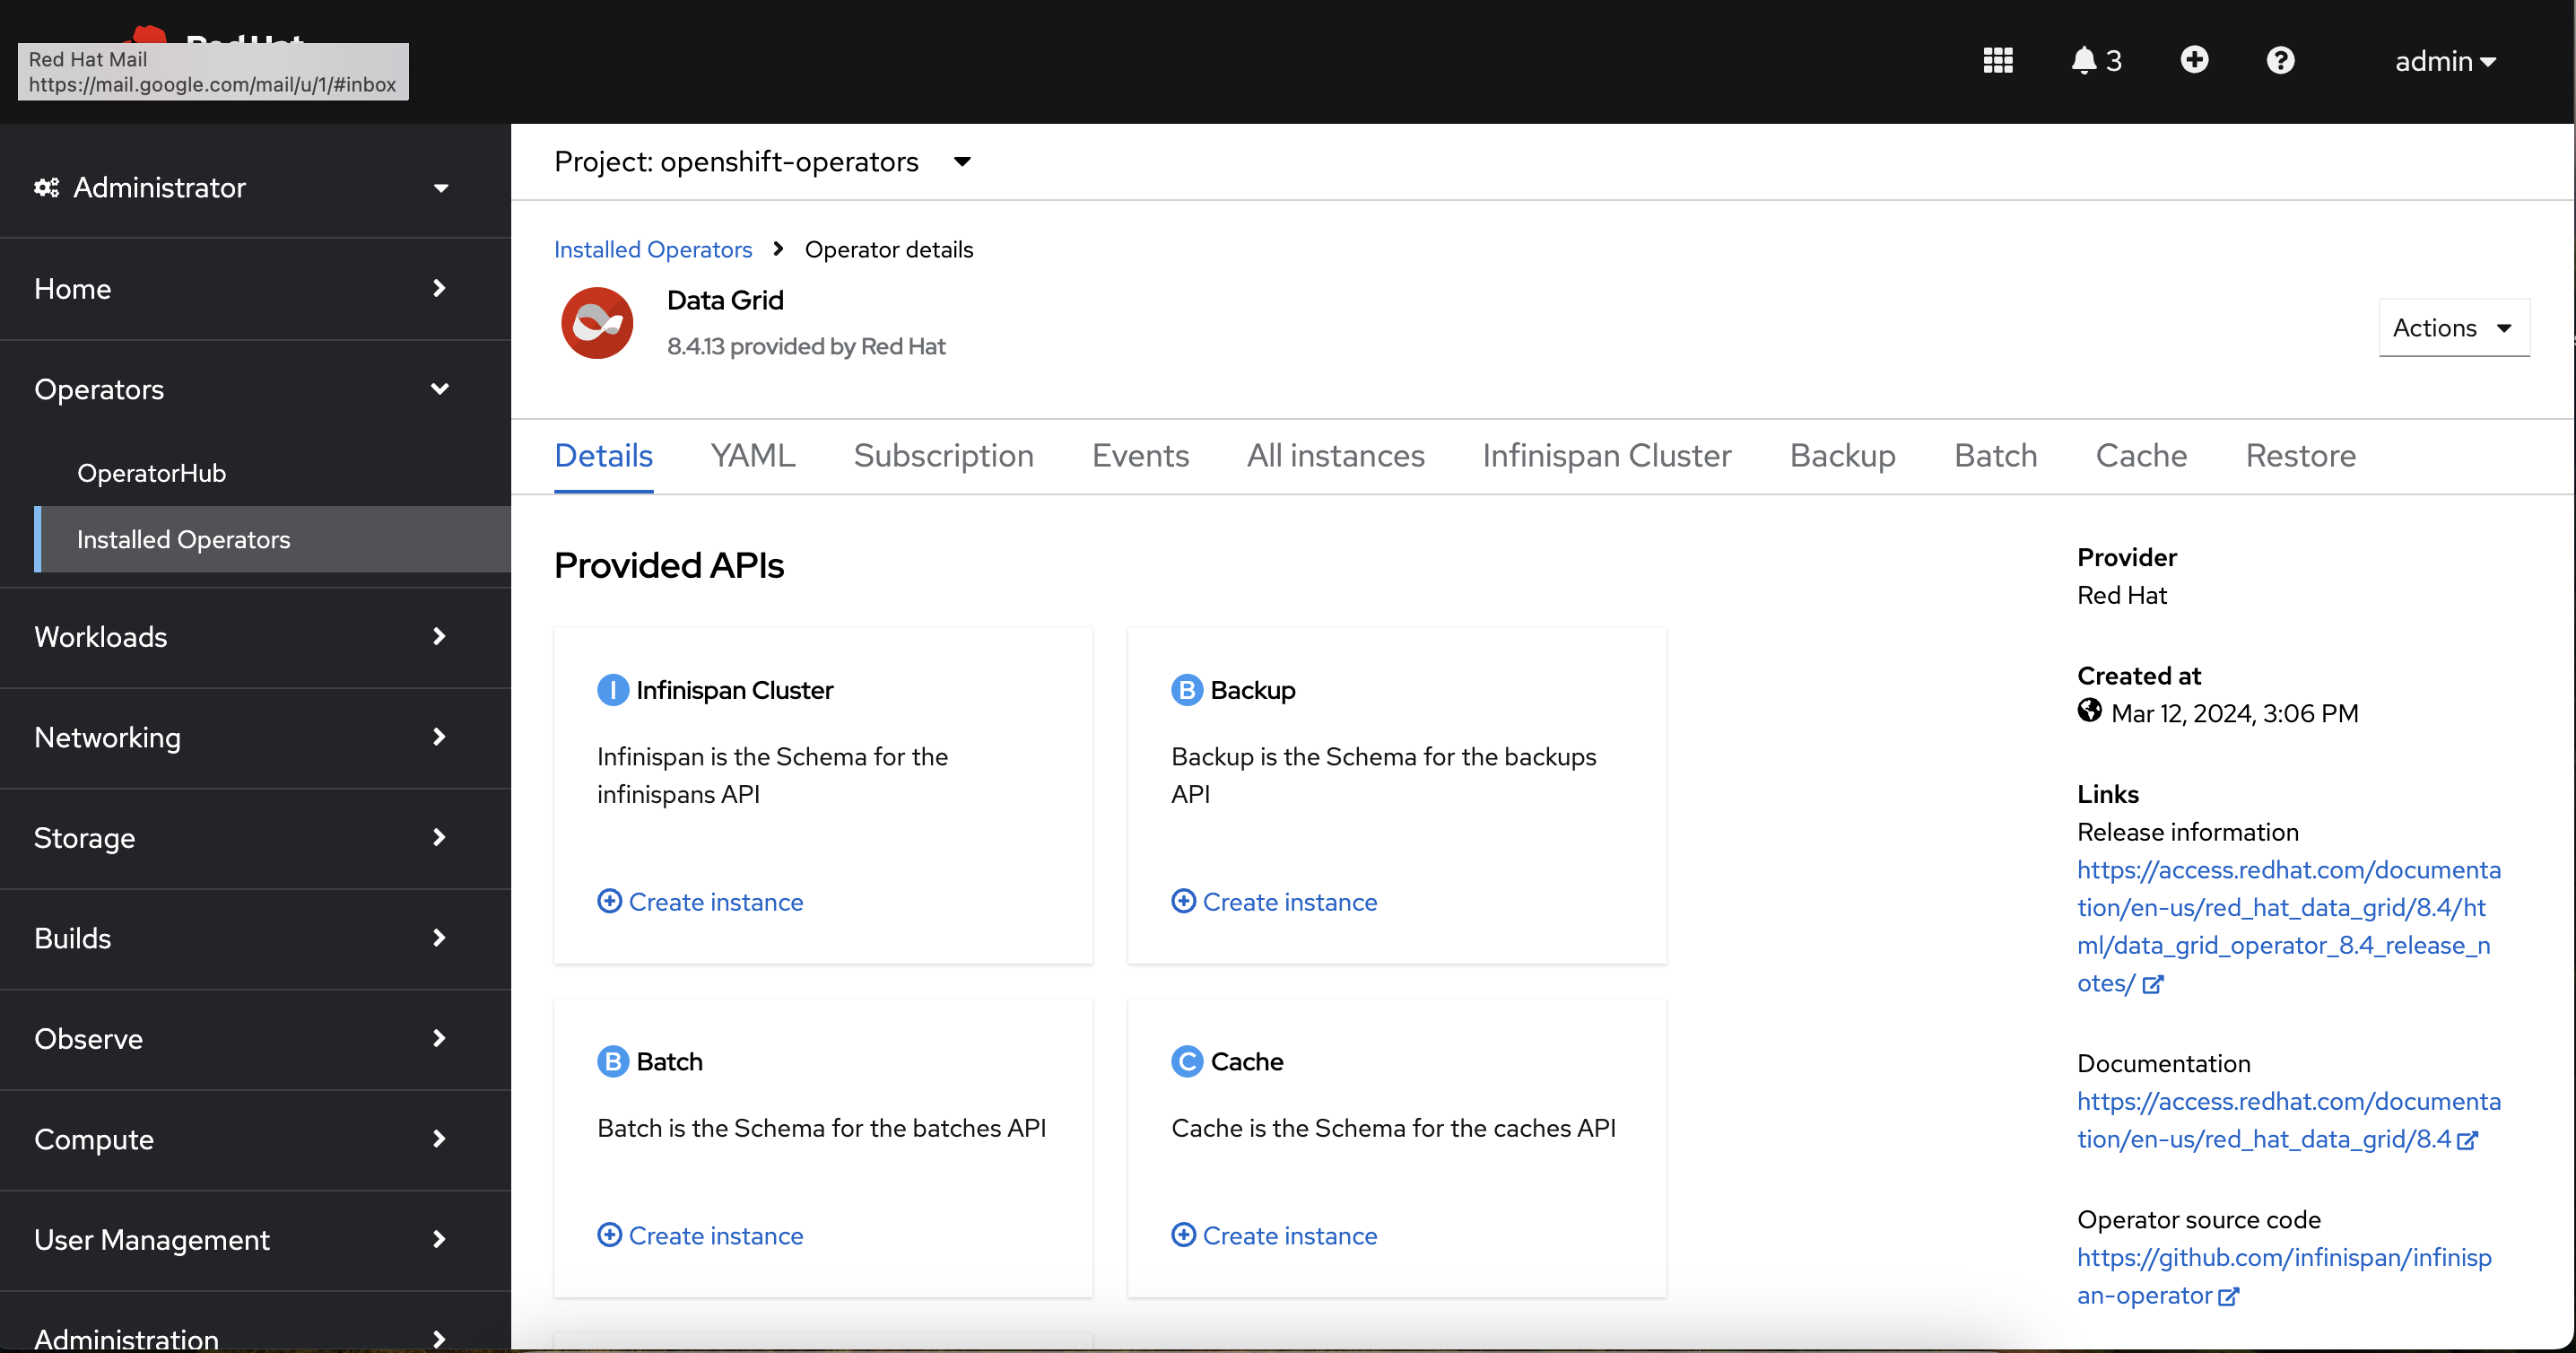
After the operator finishes installing, create a new data grid cluster. On the left menu, select Operators → Installed Operators and click Data Grid. Select Infinispan Cluster under the provided APIs.
Switch to the YAML view. Replace everything in the editor with the configuration below.
apiVersion: infinispan.org/v1
kind: Infinispan
metadata:
  name: datagrid
  namespace: openshift-operators
spec:
  security:
    authorization:
      enabled: false
    endpointEncryption:
      type: None
    endpointAuthentication: false
  dependencies:
    artifacts:
      - maven: 'com.mysql:mysql-connector-j:8.3.0'
  replicas: 1
This creates a single-replica data grid cluster. It also downloads a connector that we’ll use to save our cache data to mysql.
After our call records get stored in cache, we’ll put them in a MySQL database for future access.
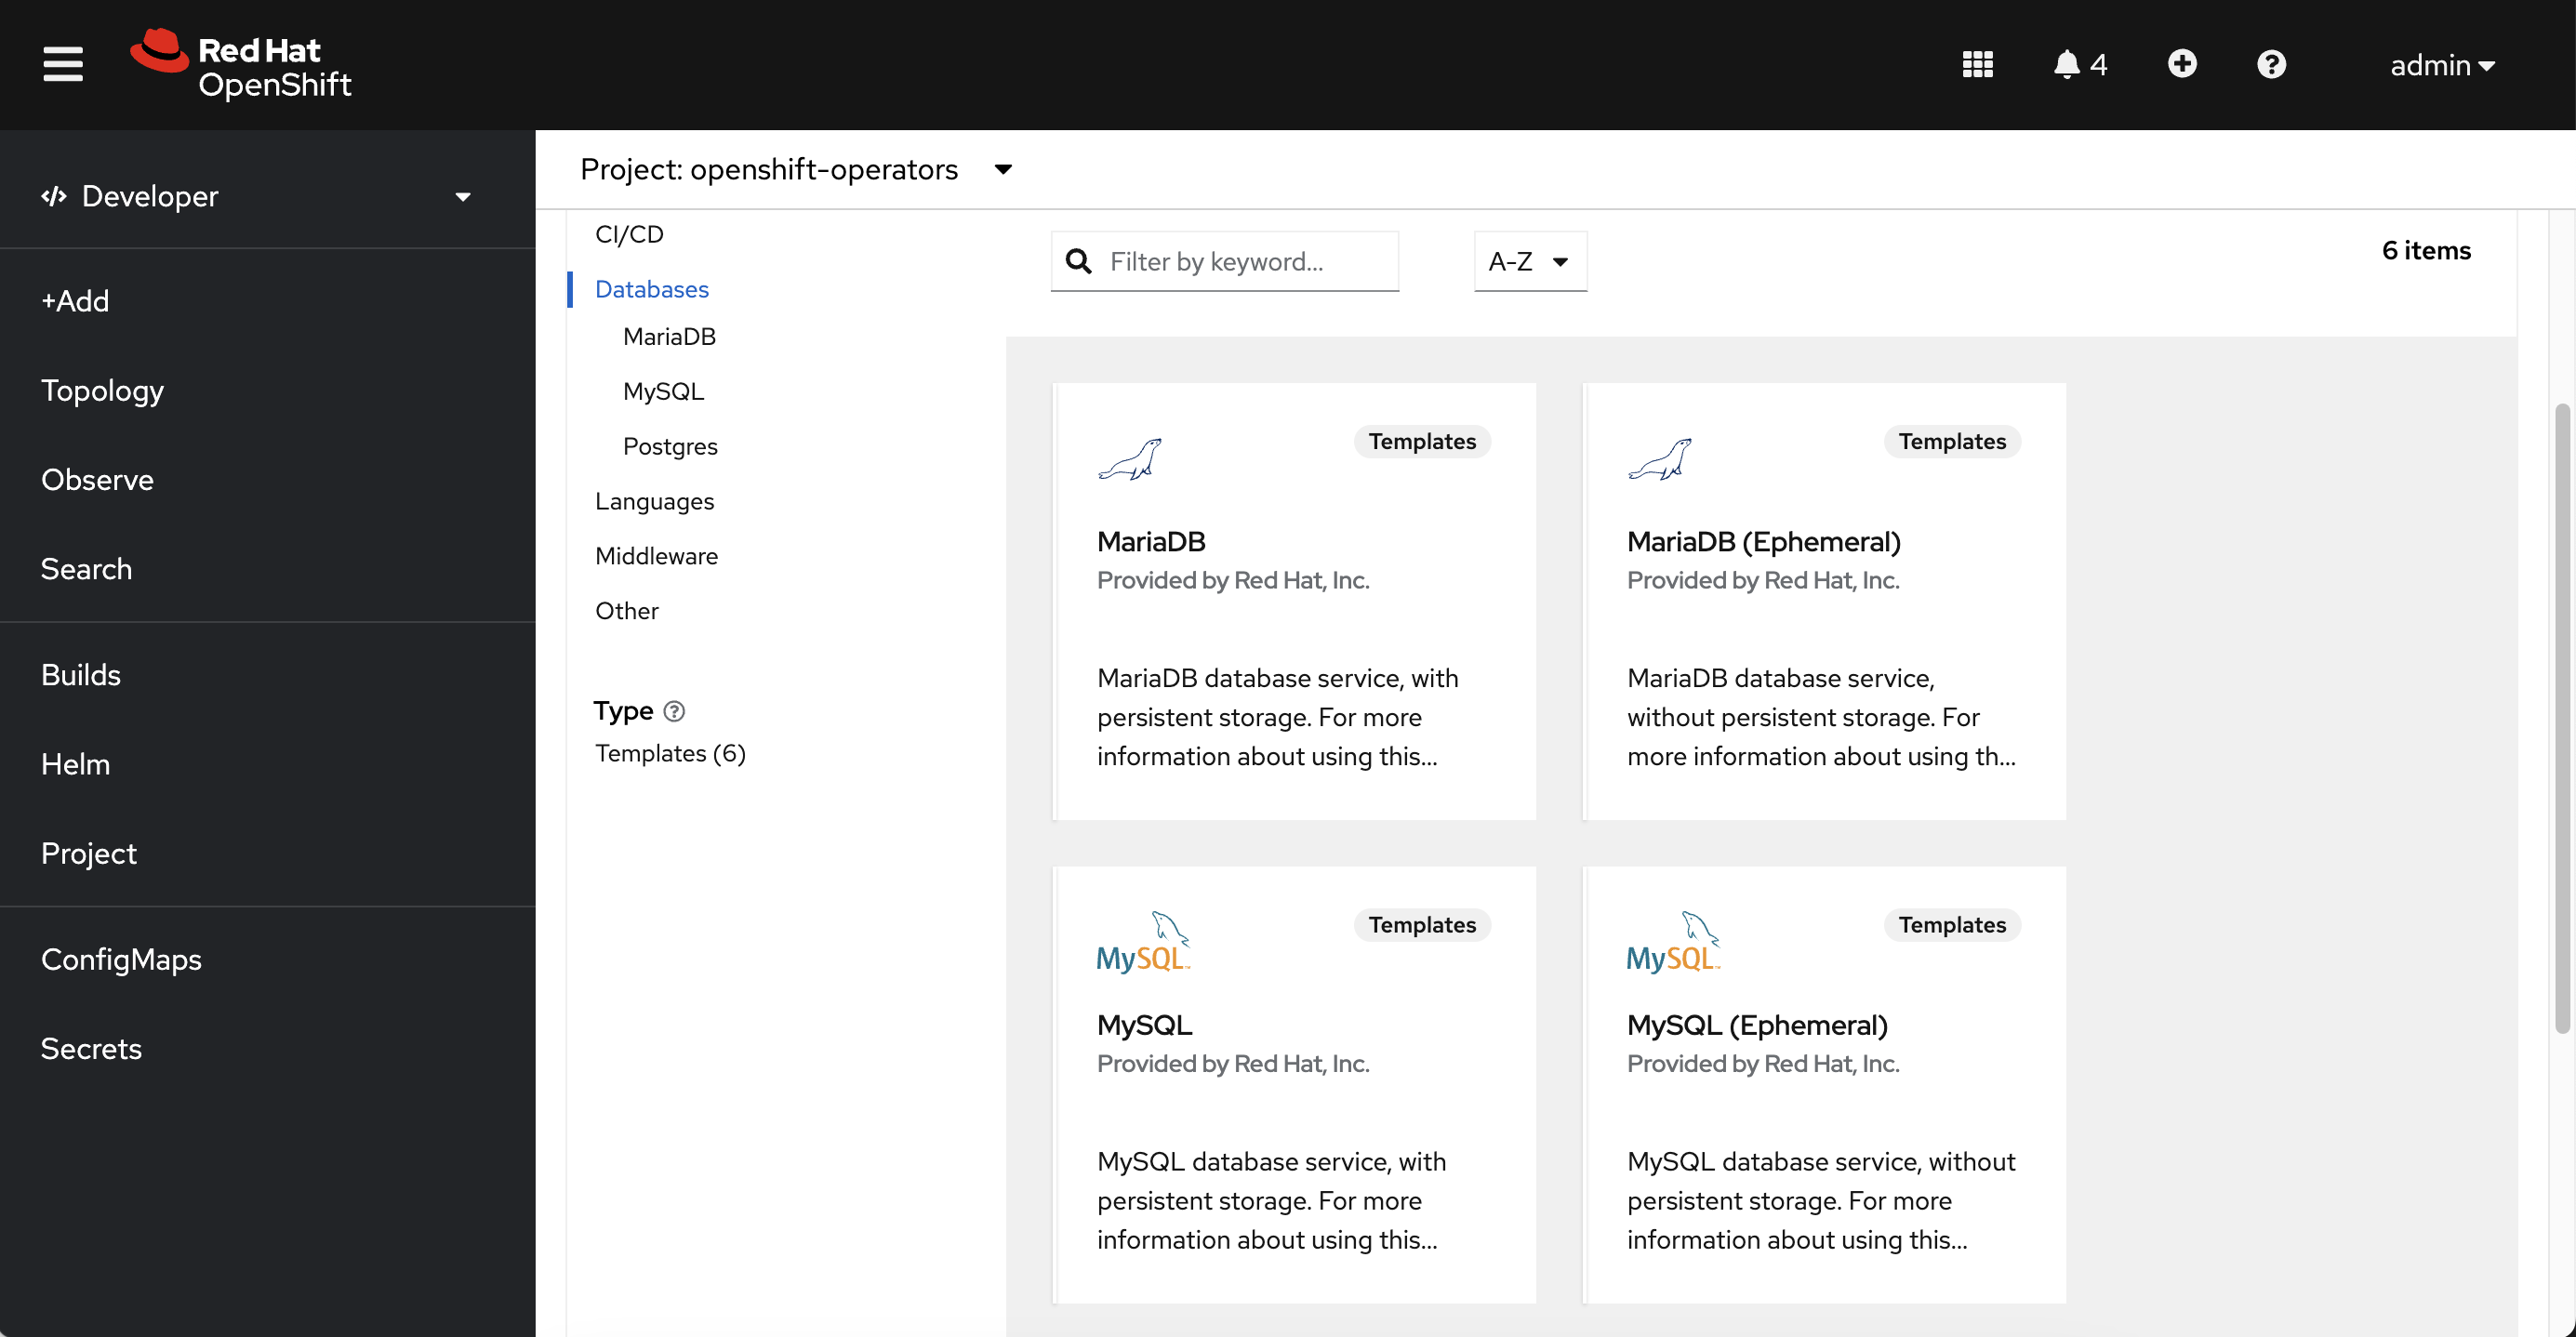
On the left menu, click Administrator and switch to the developer view. Select the openshift-operators project. Click +Add and select Database under the developer catalog.
Select mysql (Ephemeral), click Instantiate Template, and use the properties below.
Database Service Name: sensordb
MySQL Connection Username: tolarewaju3
MySQL Connection Password: tolarewaju3
MySQL Connection root user password: myP@ssword!
MySQL Database Name: sensor
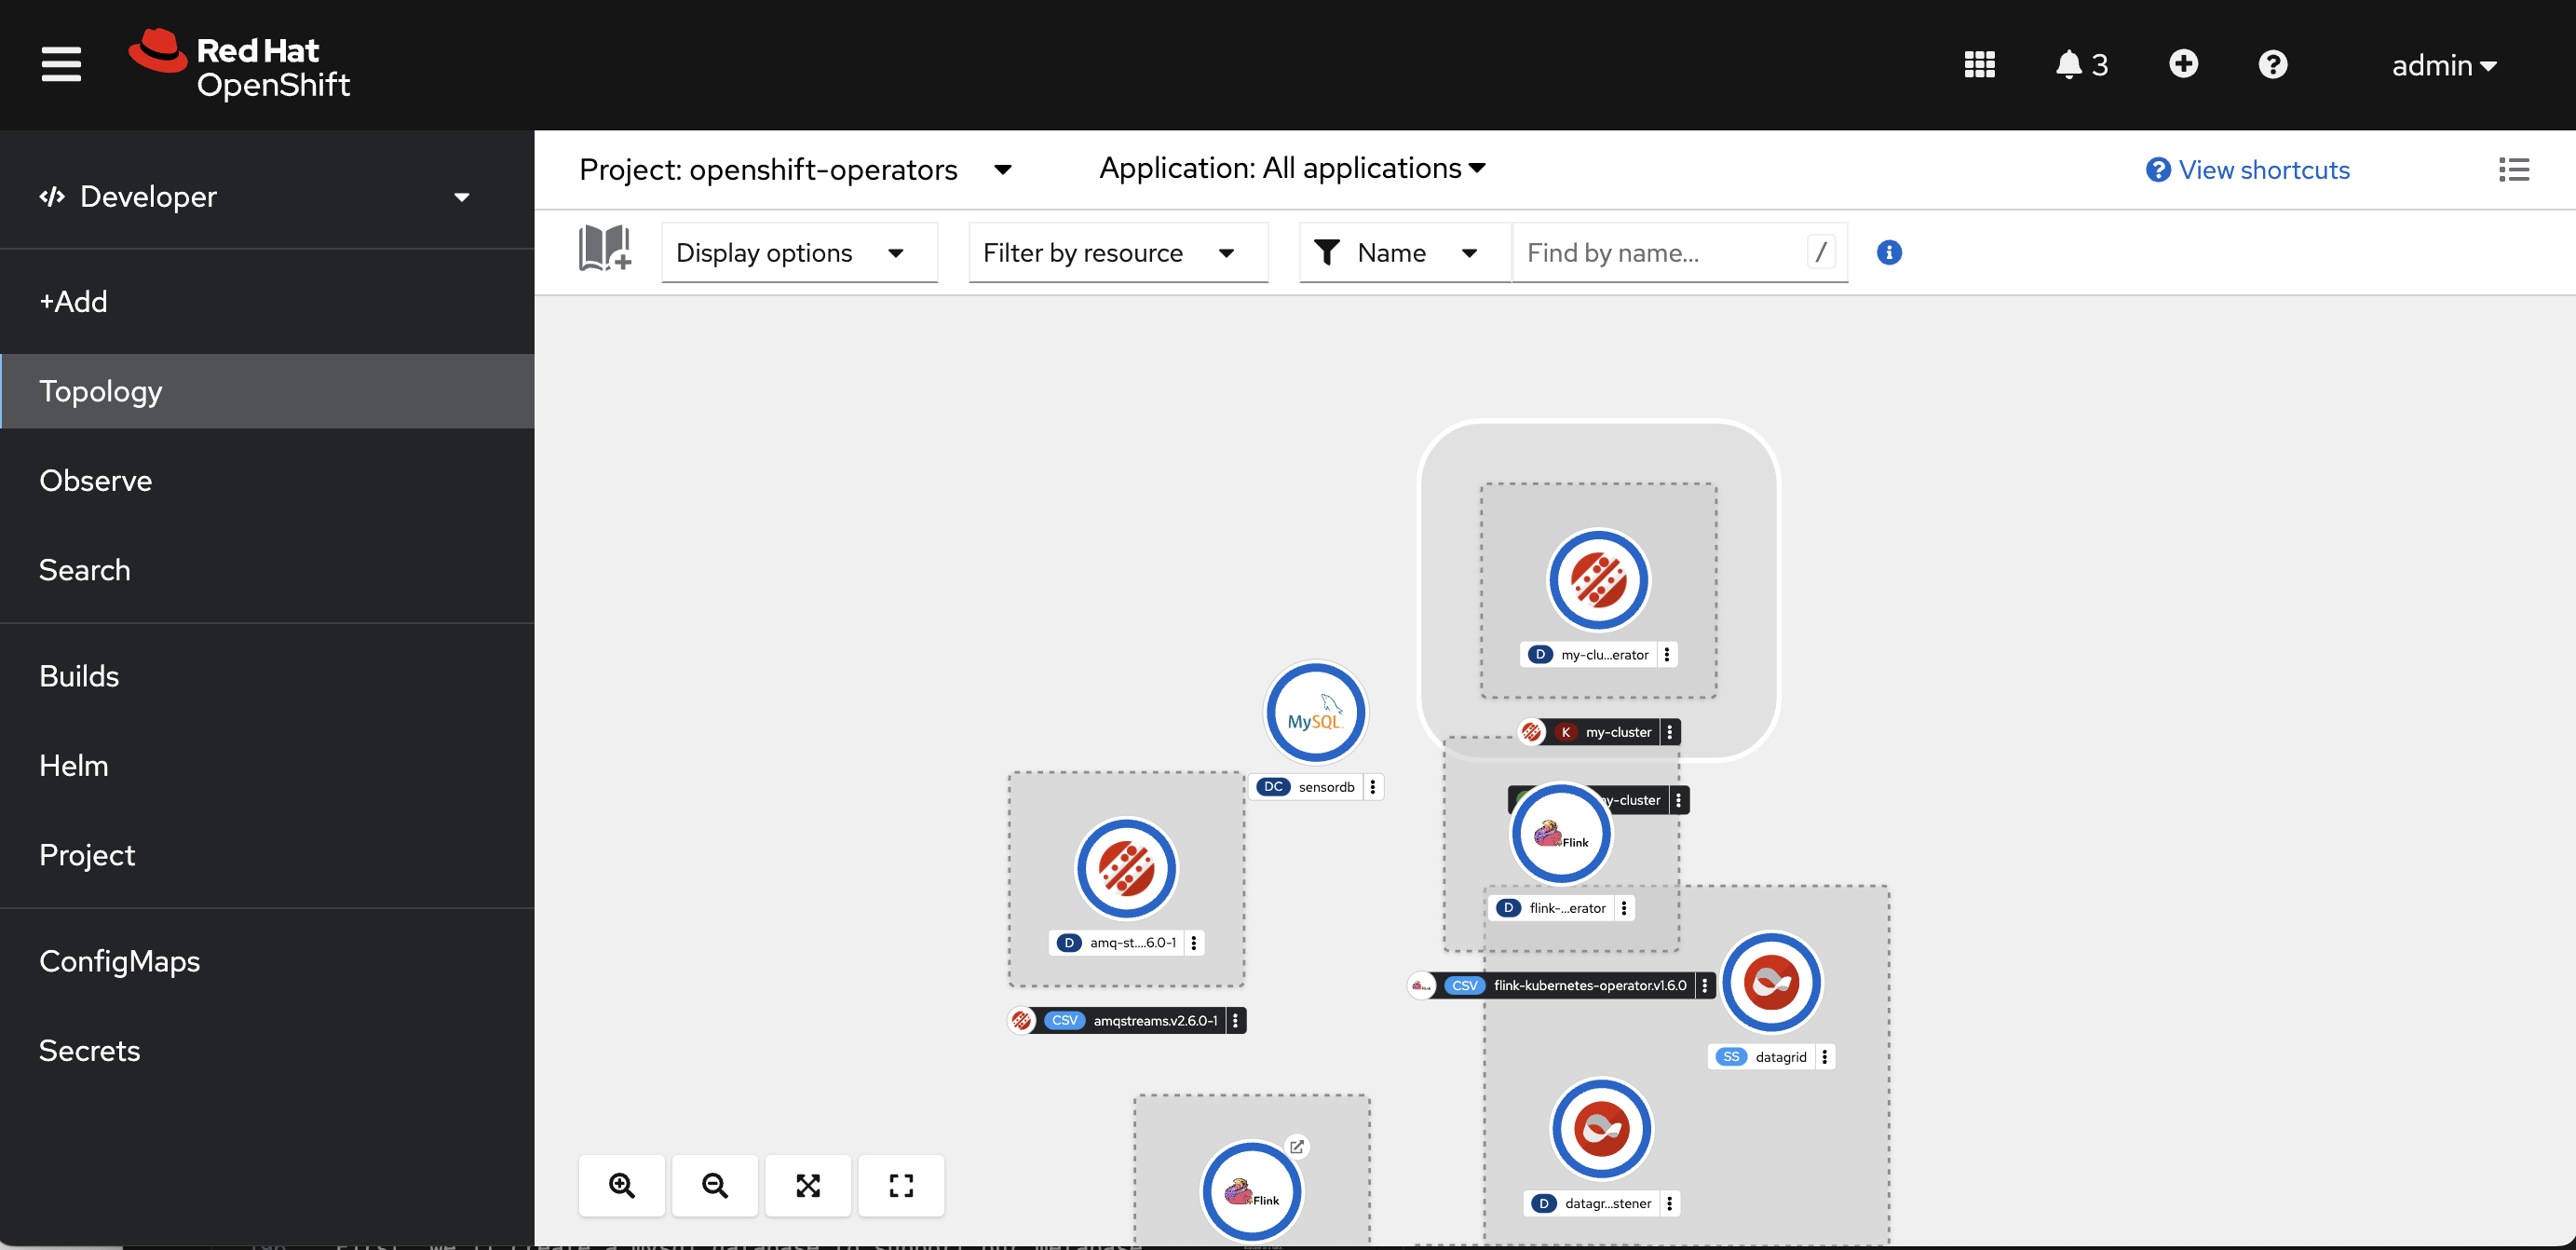
Click Create. Wait for the pod to fully deploy. You should see a blue filled circle appear over the pod.
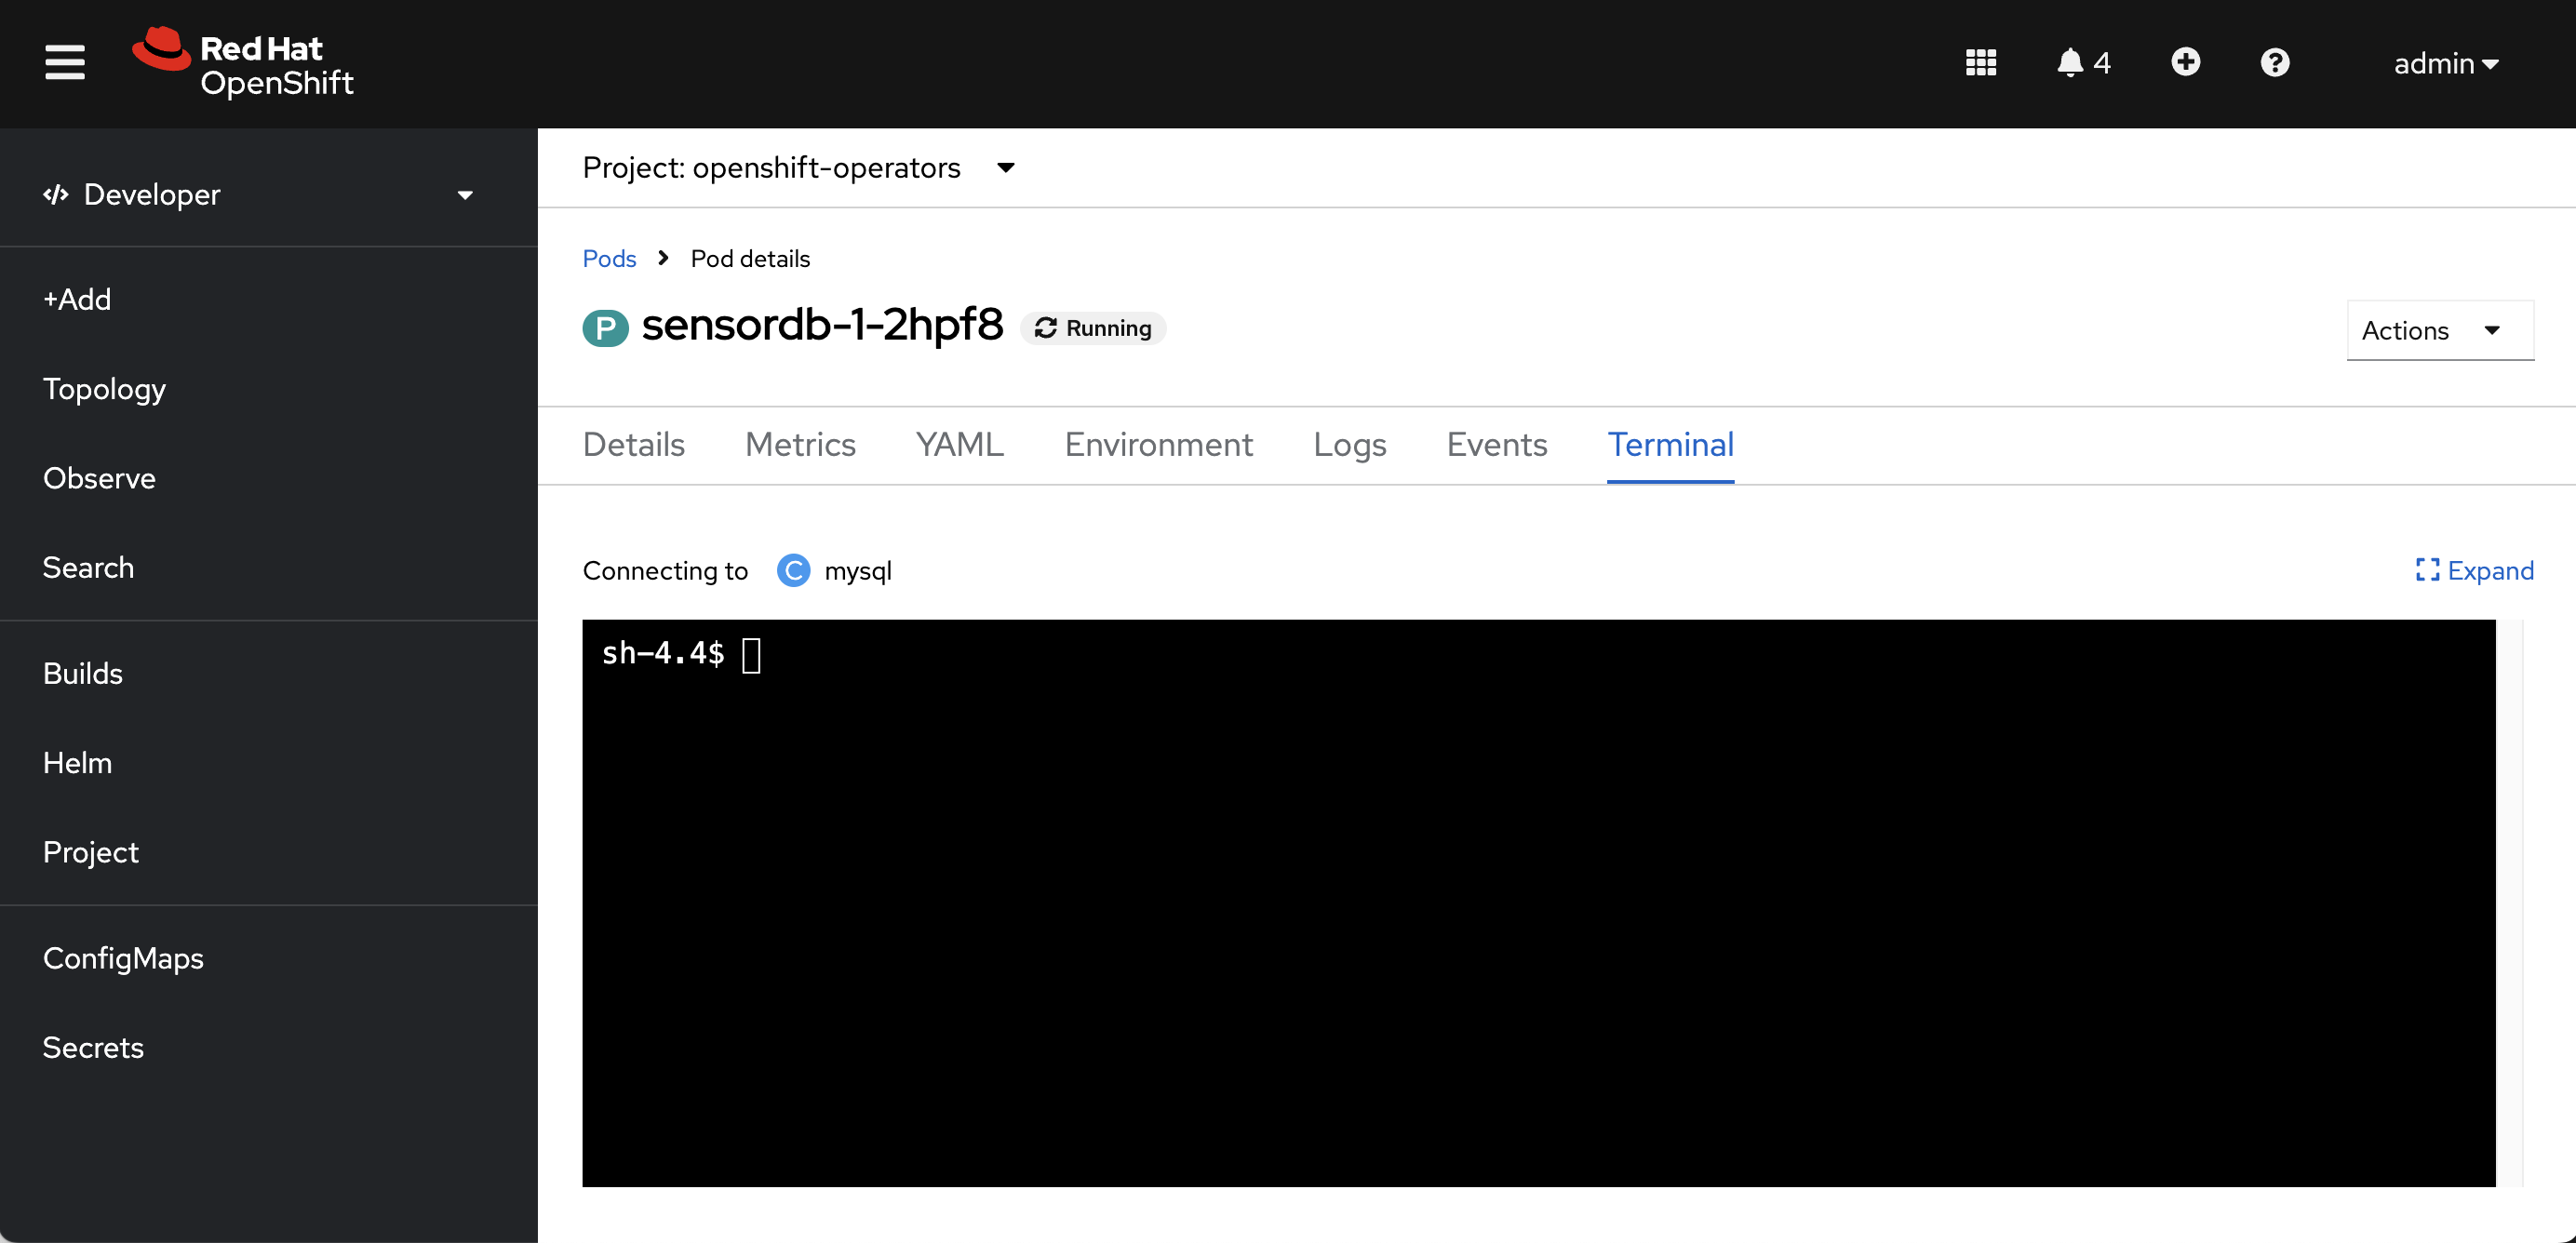
Finally, we’ll create a table to store our call events. Under topology, click on the sensordb application, click the pod name, and select Terminal.
Login to our mysql server with the password (tolarewaju3).
mysql -u tolarewaju3 -p
Change the database to sensor.
USE sensor;
Create a table for our call records.
CREATE TABLE call_record (
    id INT PRIMARY KEY,
    timestamp TIMESTAMP NOT NULL DEFAULT CURRENT_TIMESTAMP,
    location varchar(255),
    signalStrength varchar(255),
    network varchar(255)
);
Cell data is often unstructured, so we’ll use Apache Flink to transform it and store it in data grid.
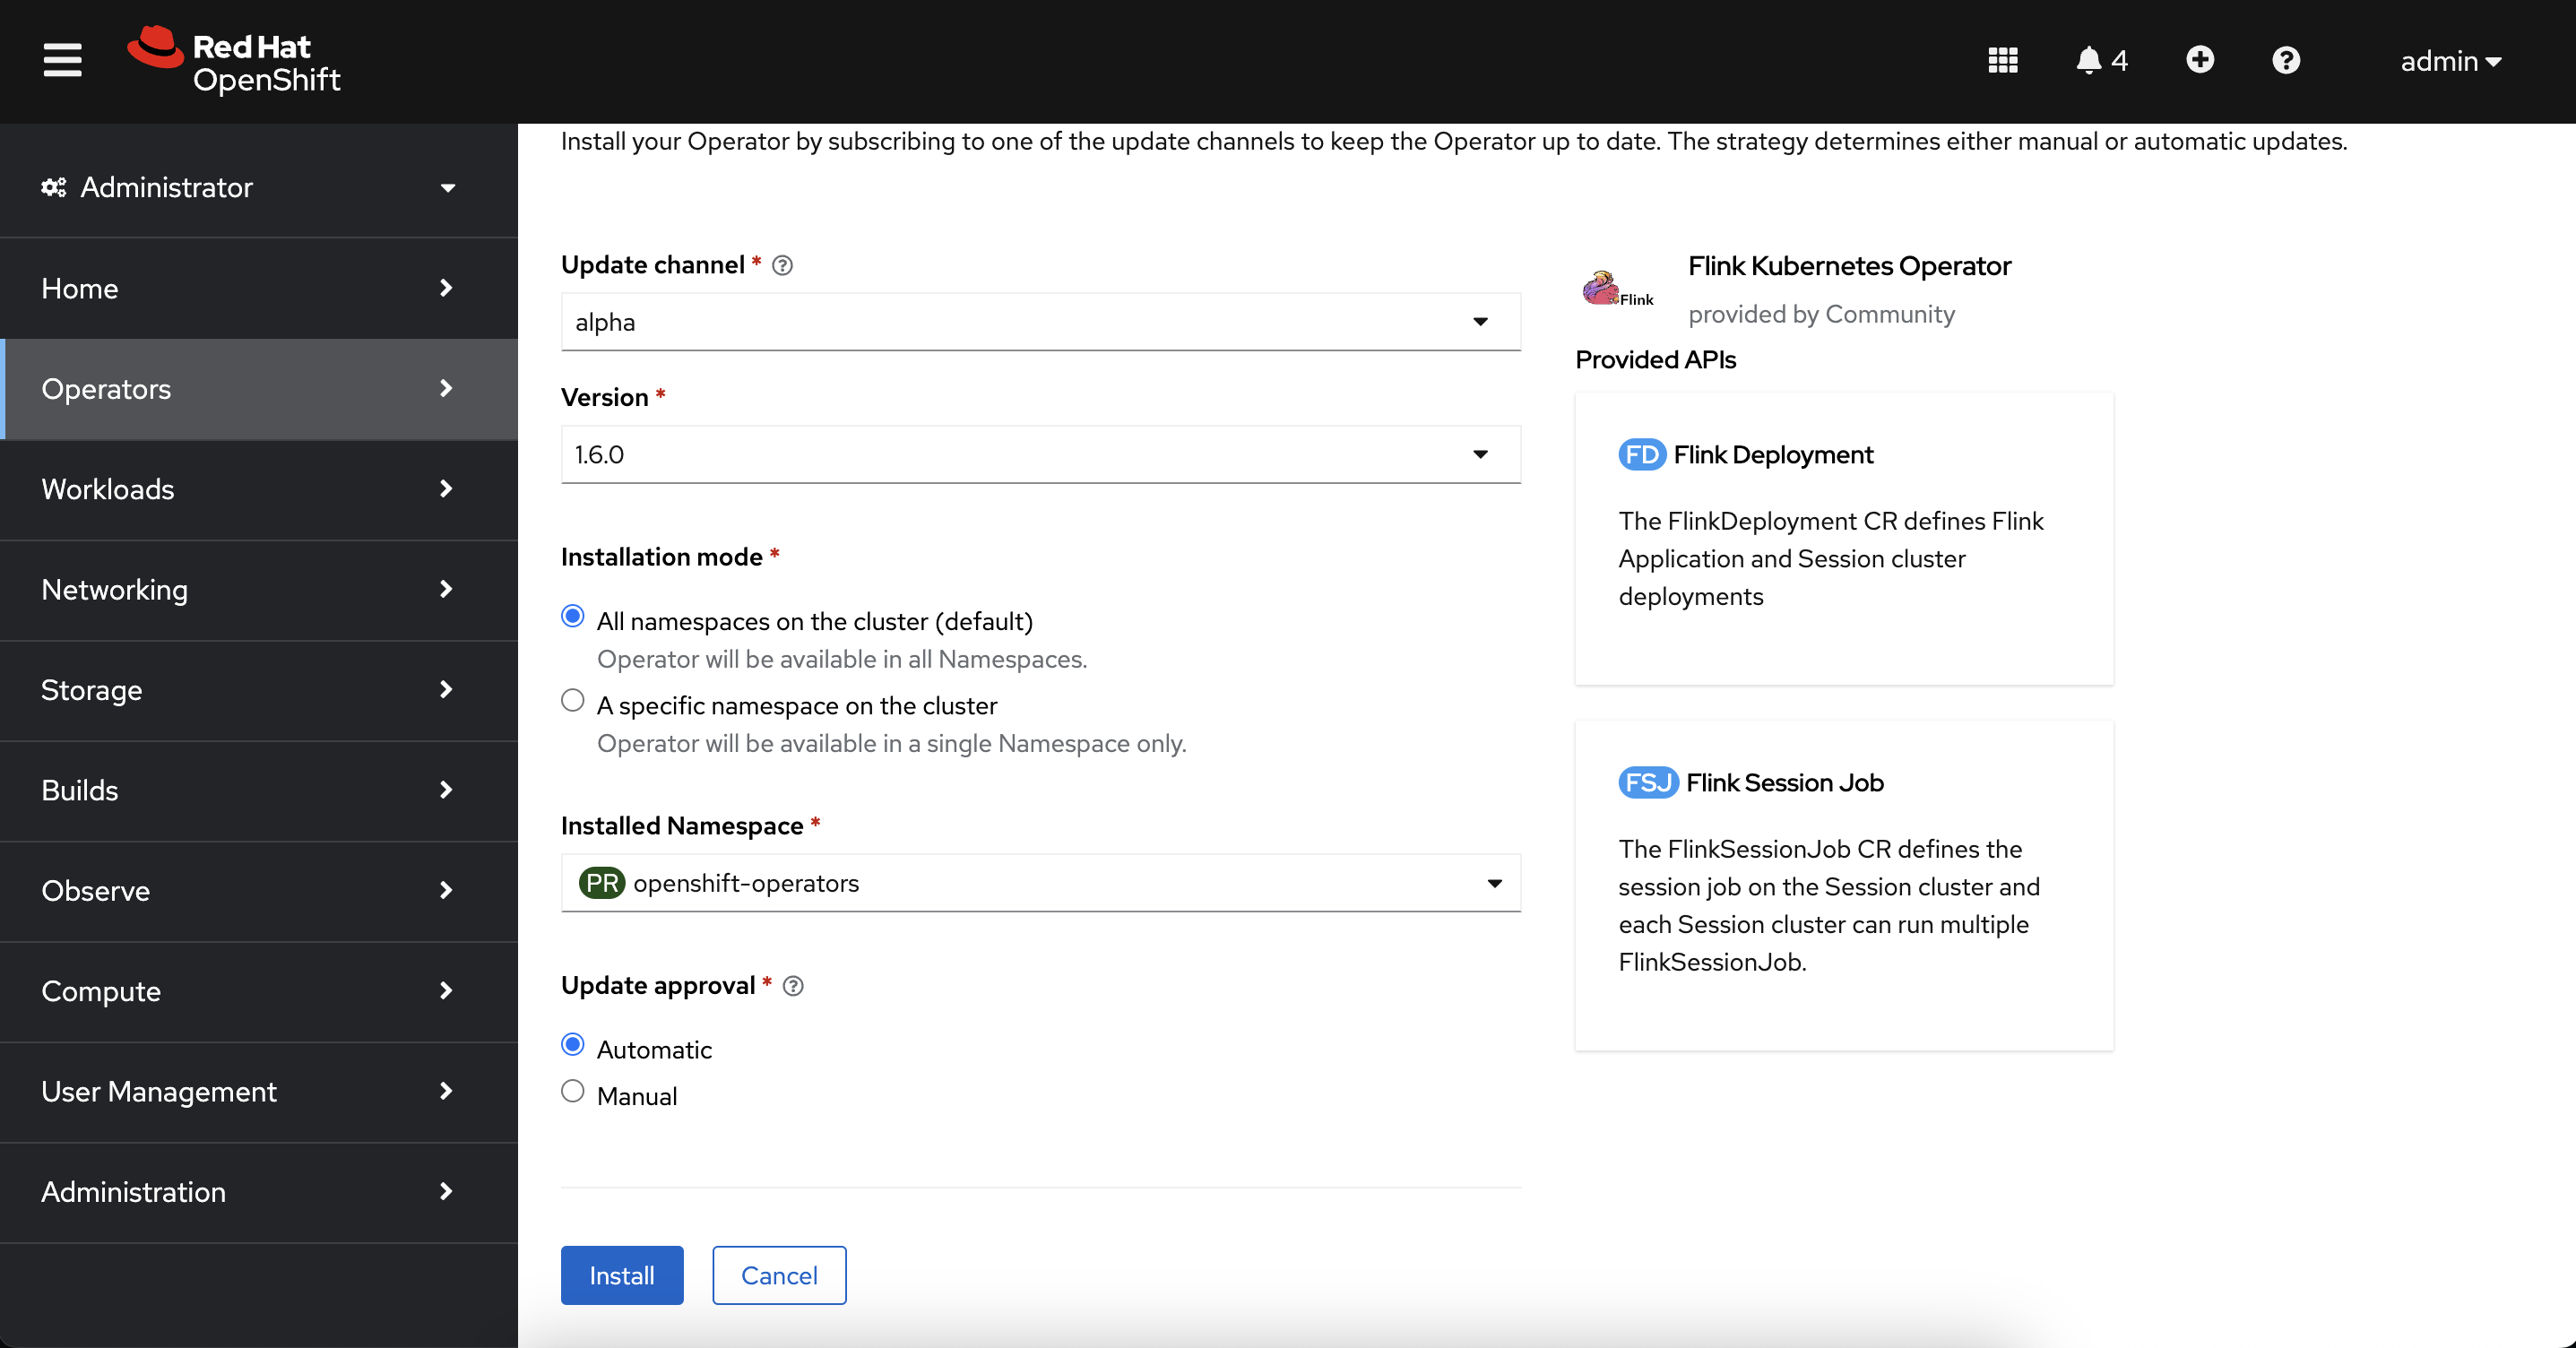
First, install the Flink Operator. Switch back to the Administrator view. On the left menu, select Operators → OperatorHub and type Flink. Select Flink Kubernetes Operator, click Install, and make sure the you're using the openshift-operator namespace. Create the flink operator.
After the operator finishes installing, we’ll create a new Flink deployment. On the left menu, select Operators → Installed Operators and click Flink Kubernetes Operator. Under the Provided APIs, select Flink deployment.
Switch the view to YAML and replace everything with the configuration below.
kind: FlinkDeployment
apiVersion: flink.apache.org/v1beta1
metadata:
  name: flink-streaming
  namespace: openshift-operators
spec:
  image: 'flink:1.16'
  flinkVersion: v1_16
  flinkConfiguration:
    taskmanager.numberOfTaskSlots: '2'
  serviceAccount: flink
  jobManager:
    resource:
      memory: 2048m
      cpu: 1
  taskManager:
    resource:
      memory: 2048m
      cpu: 1
We’ll also create a route so we can access the Flink deployment. On the right hand menu, click Networking → Routes. Click Create route, change to the YAML view, and replace everything in the editor with the configuration below.
kind: Route
apiVersion: route.openshift.io/v1
metadata:
  name: flink-rest
  namespace: openshift-operators
  labels:
    app: flink-streaming
    type: flink-native-kubernetes
spec:
  to:
    kind: Service
    name: flink-streaming-rest
  tls: null
  port:
    targetPort: rest
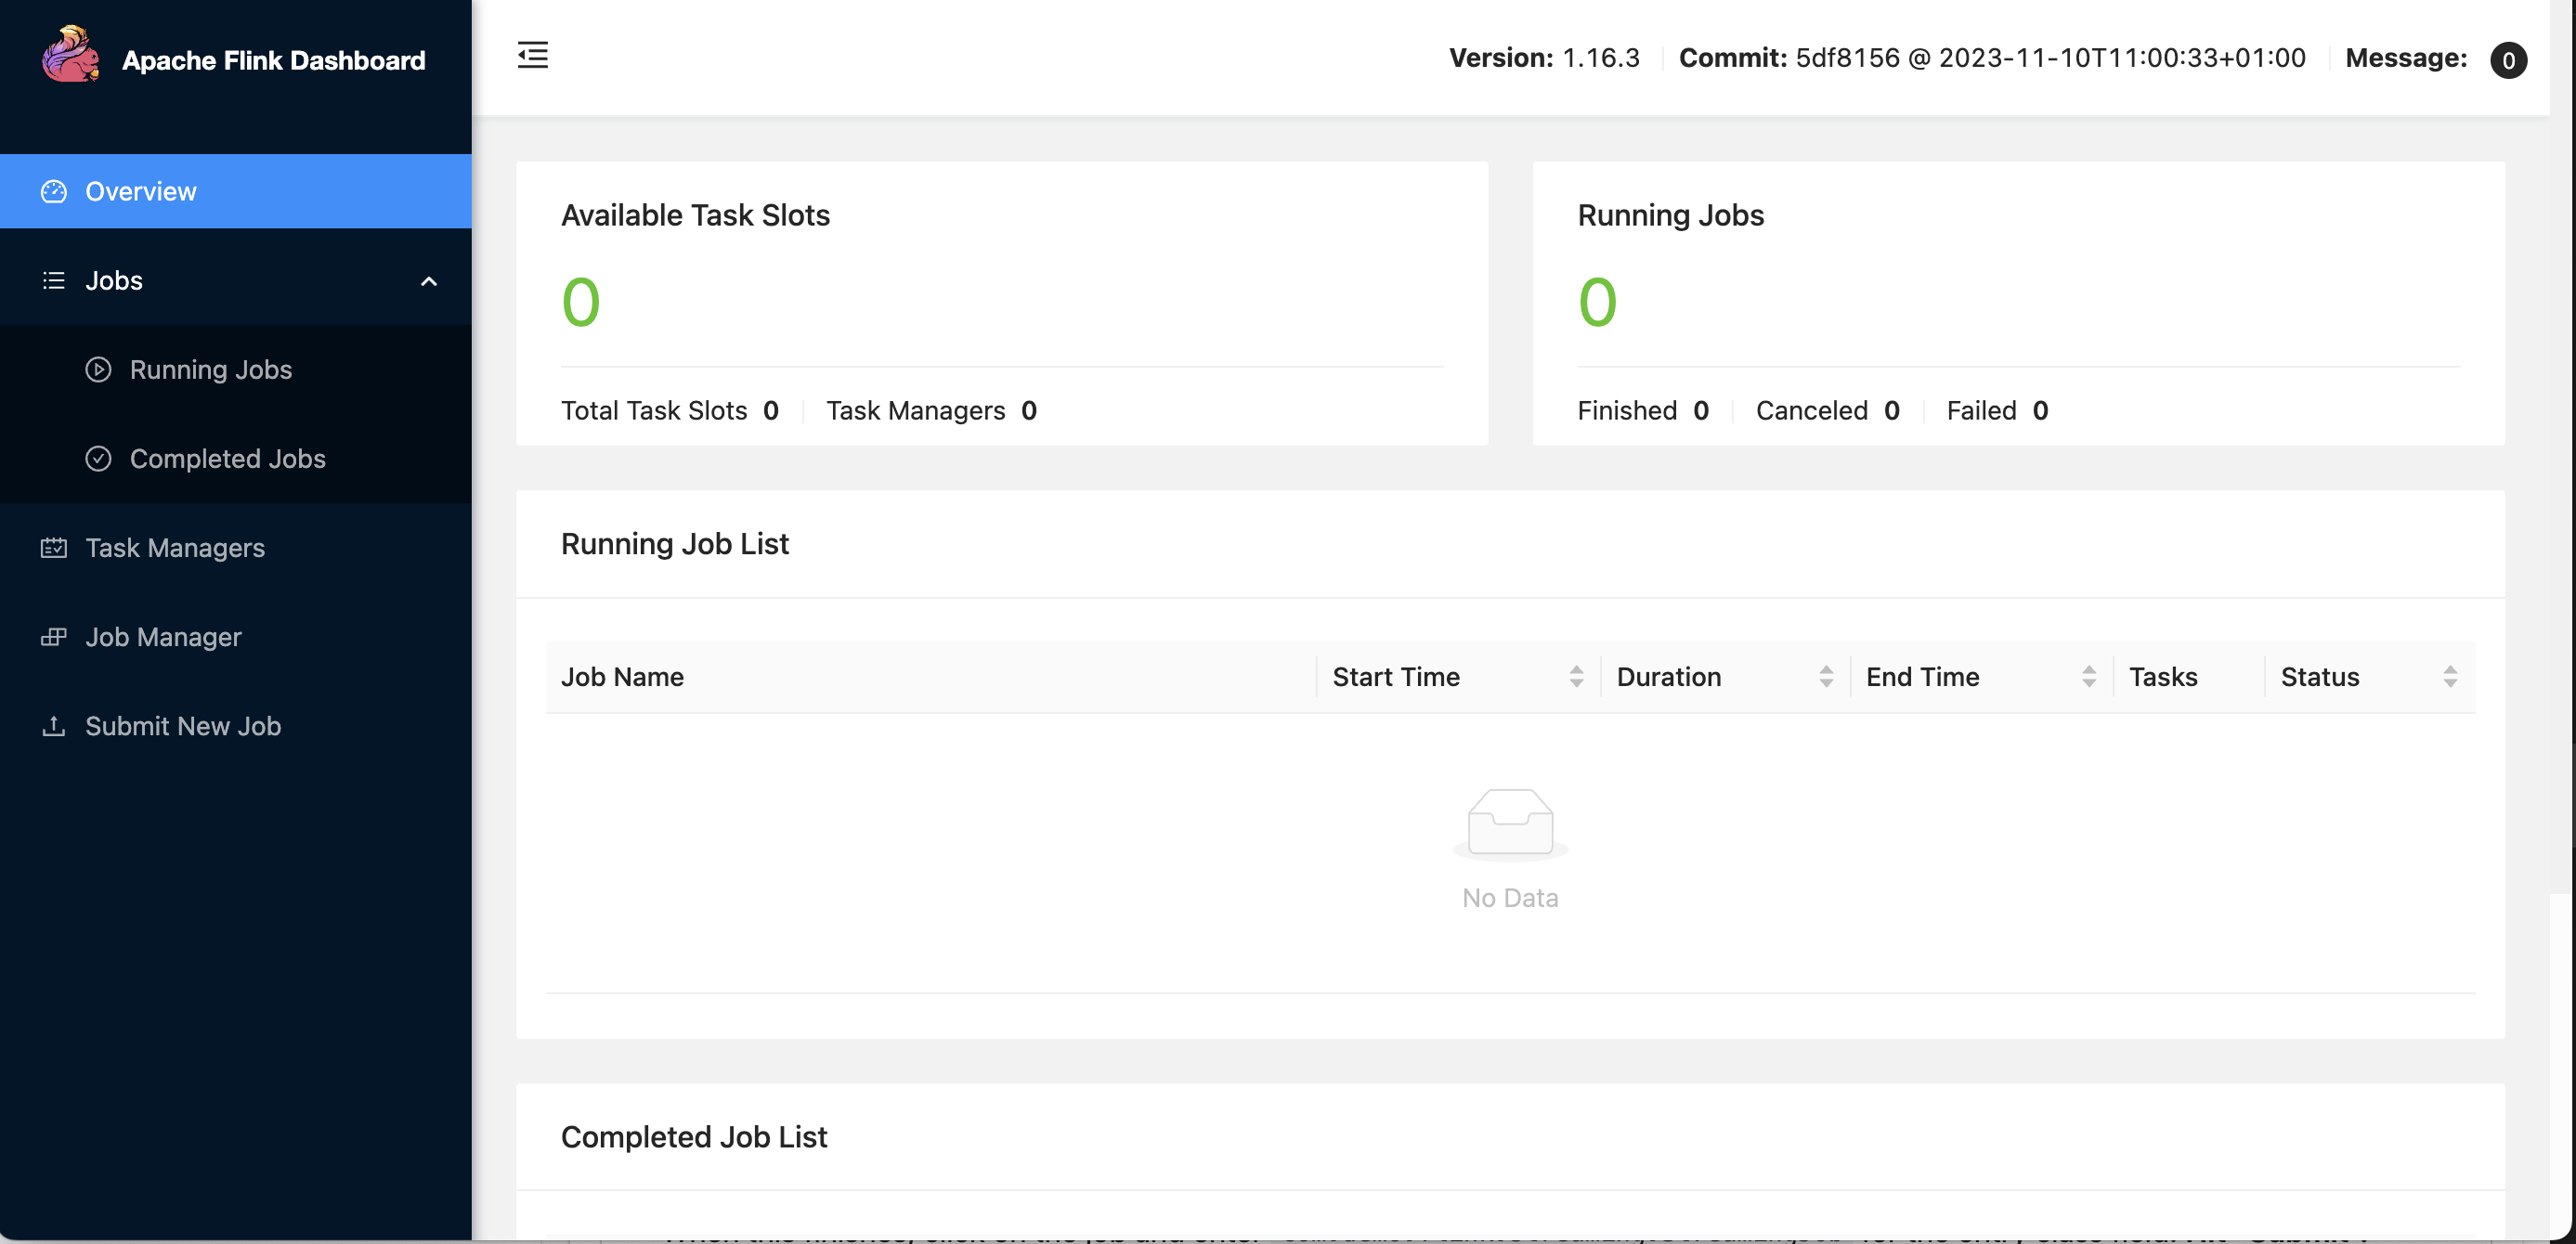
Next, we’ll deploy a Flink job that transforms our call record data into a form that’s suitable for storage and viewing. Under Location, navigate to the Flink deployment url. If you get an error, make sure your browser didn’t change the “http” to “https”
On the left menu, select Submit New Job. Click +Add New and upload this jar. This may take a minute. When this finishes, click on the job and enter com.demo.flink.streaming.StreamingJob for the entry class field. Submit the job.
Now, we’ll generate some call record data. Go back to the OpenShift console and switch to the Developer view.
Click +Add and select Container Images under the Developer Catalog. Fill in the properties below.
Image name from external registry: tolarewaju3/call-record-generator-amd64
Application: No application group
Name: call-record-generator
We’ll create a dashboard that shows interesting facts about our data. Metabase is a great library that makes it easy for us to visualize data.
First, we’ll create a database for the metabase container. On the left menu, switch to the developer view. Make sure the openshift-operator project is selected. Click the +Add button under the Developer Catalog. Select Database.
Select MySql (Ephemeral), click Instantiate Template and use the properties below.
Namespace: openshift-operators
Database Service Name: metabasedb
MySQL Connection Username: tolarewaju3
MySQL Connection Password: tolarewaju3
MySQL Database Name: metabase
Next, we’ll create our metabase container. Click the “+Add” and select “Container Images”. Fill in the properties below.
Image name from external registry: metabase/metabase
Application: No application group
Name: metabase
Set environment properties on our container. On the bottom of the window, select “Deployment” and fill in the following variables.
MB_DB_TYPE: mysql
MB_DB_DBNAME: metabase
MB_DB_PORT: 3306
MB_DB_USER: tolarewaju3
MB_DB_PASS: tolarewaju3
MB_DB_HOST: metabasedb
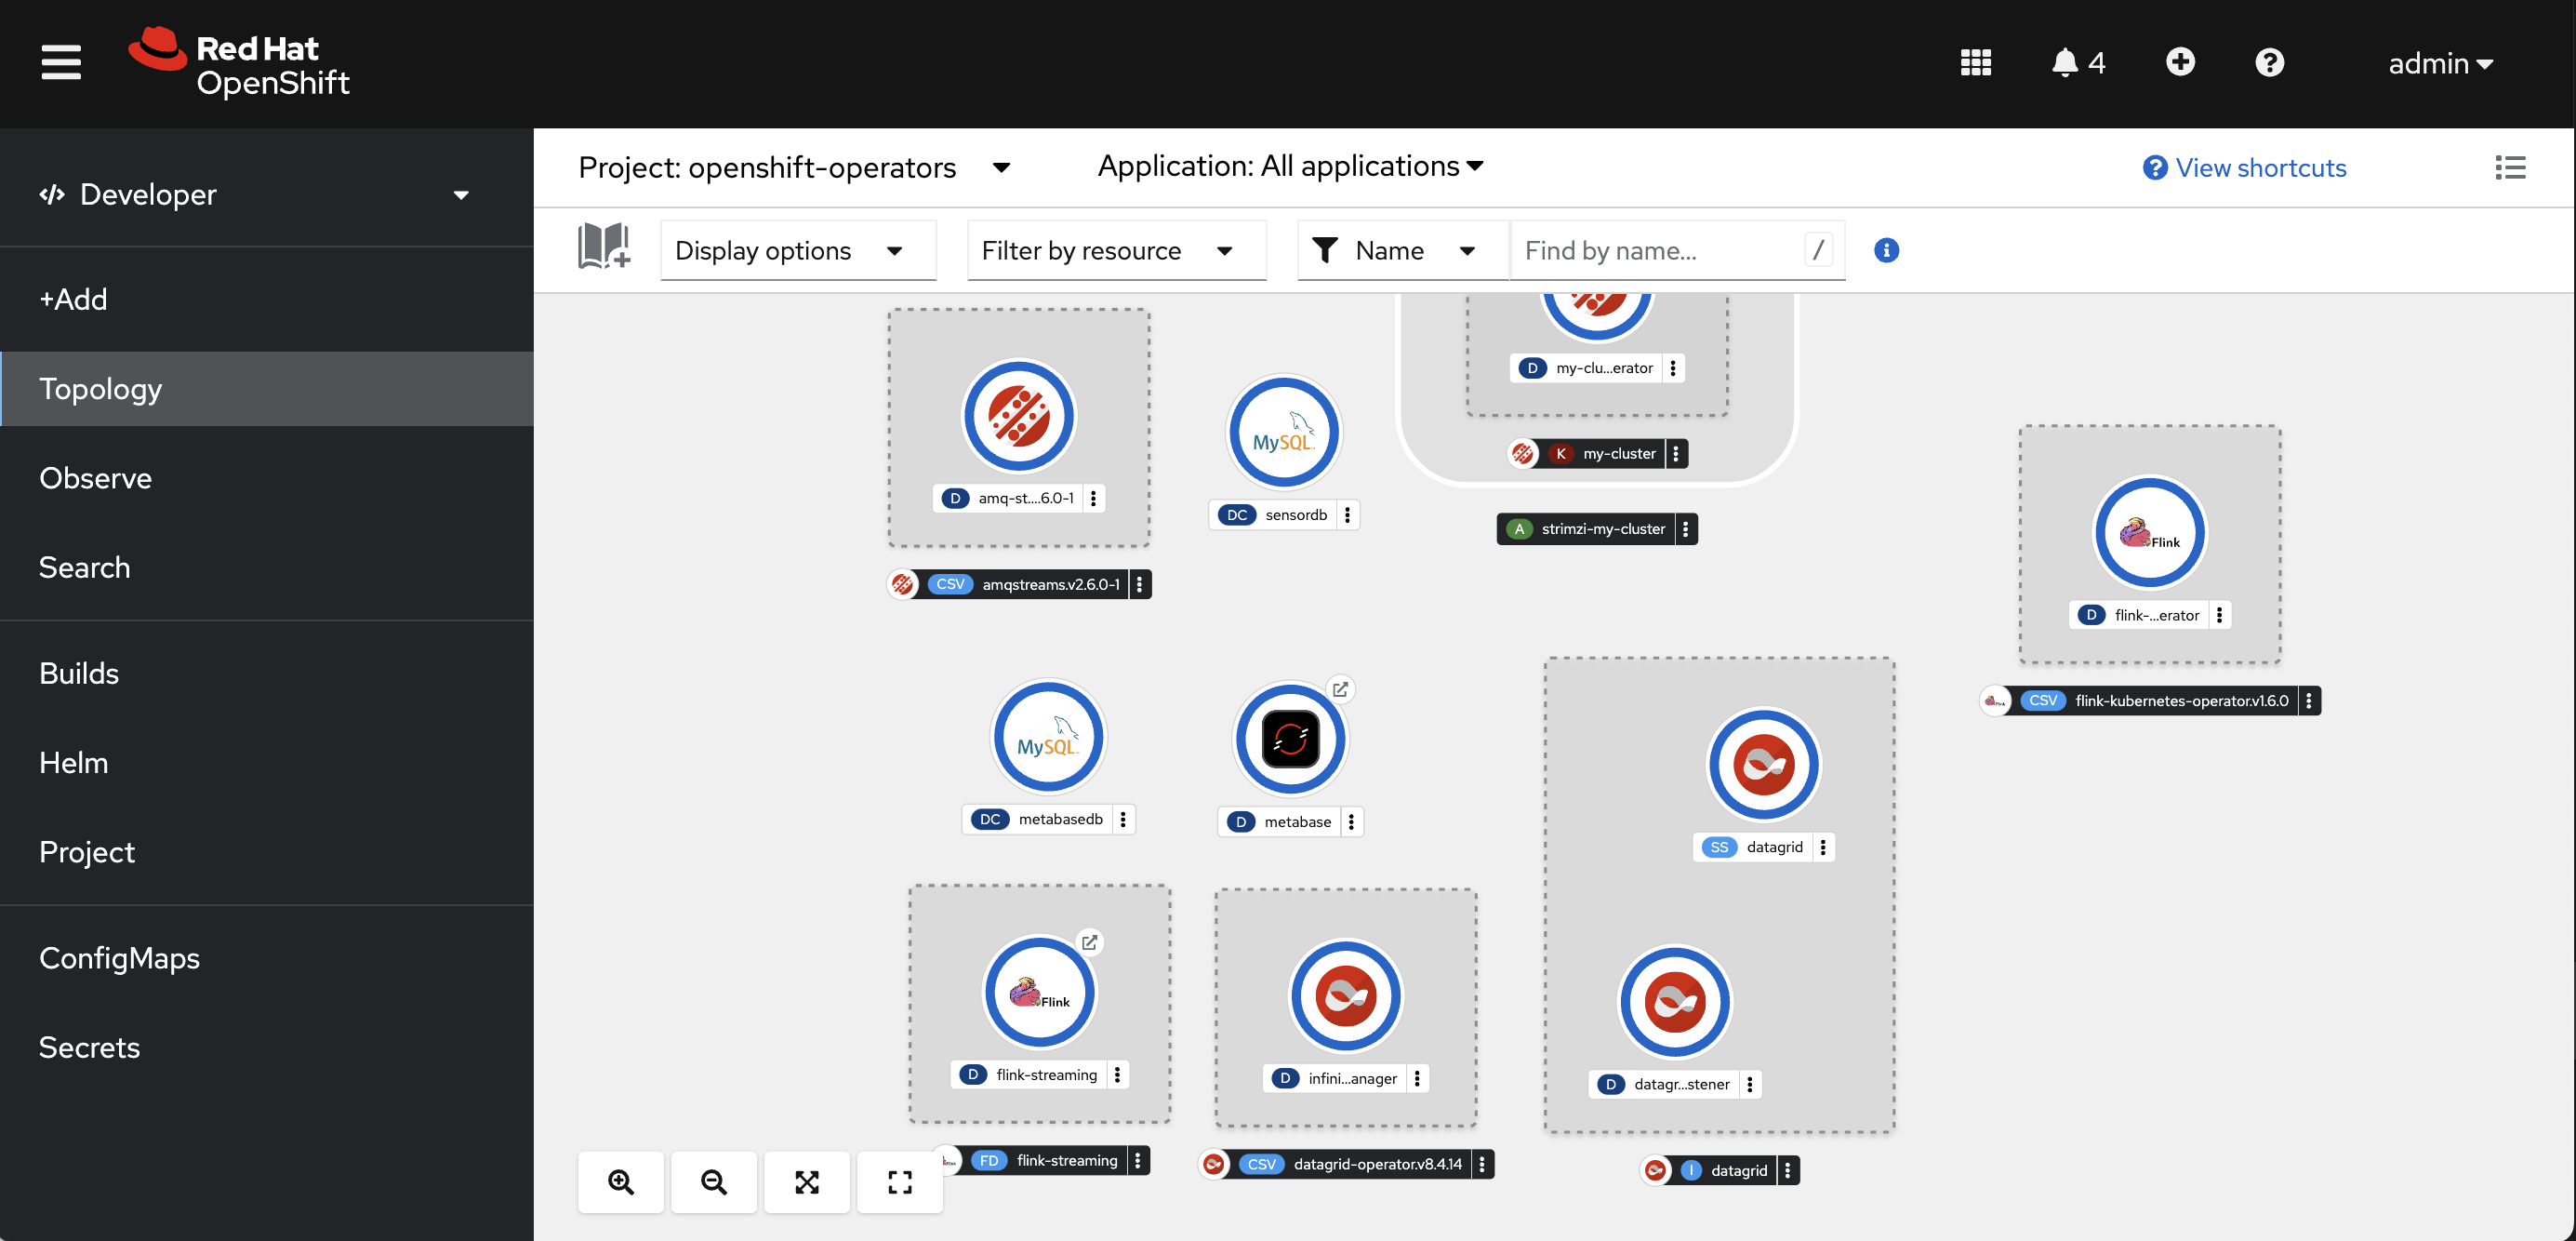
Wait until the deployment finishes. You’ll see a dark blue ring around the pod.
Open the Matabase dashboard. Click the link in the top right of the pod.
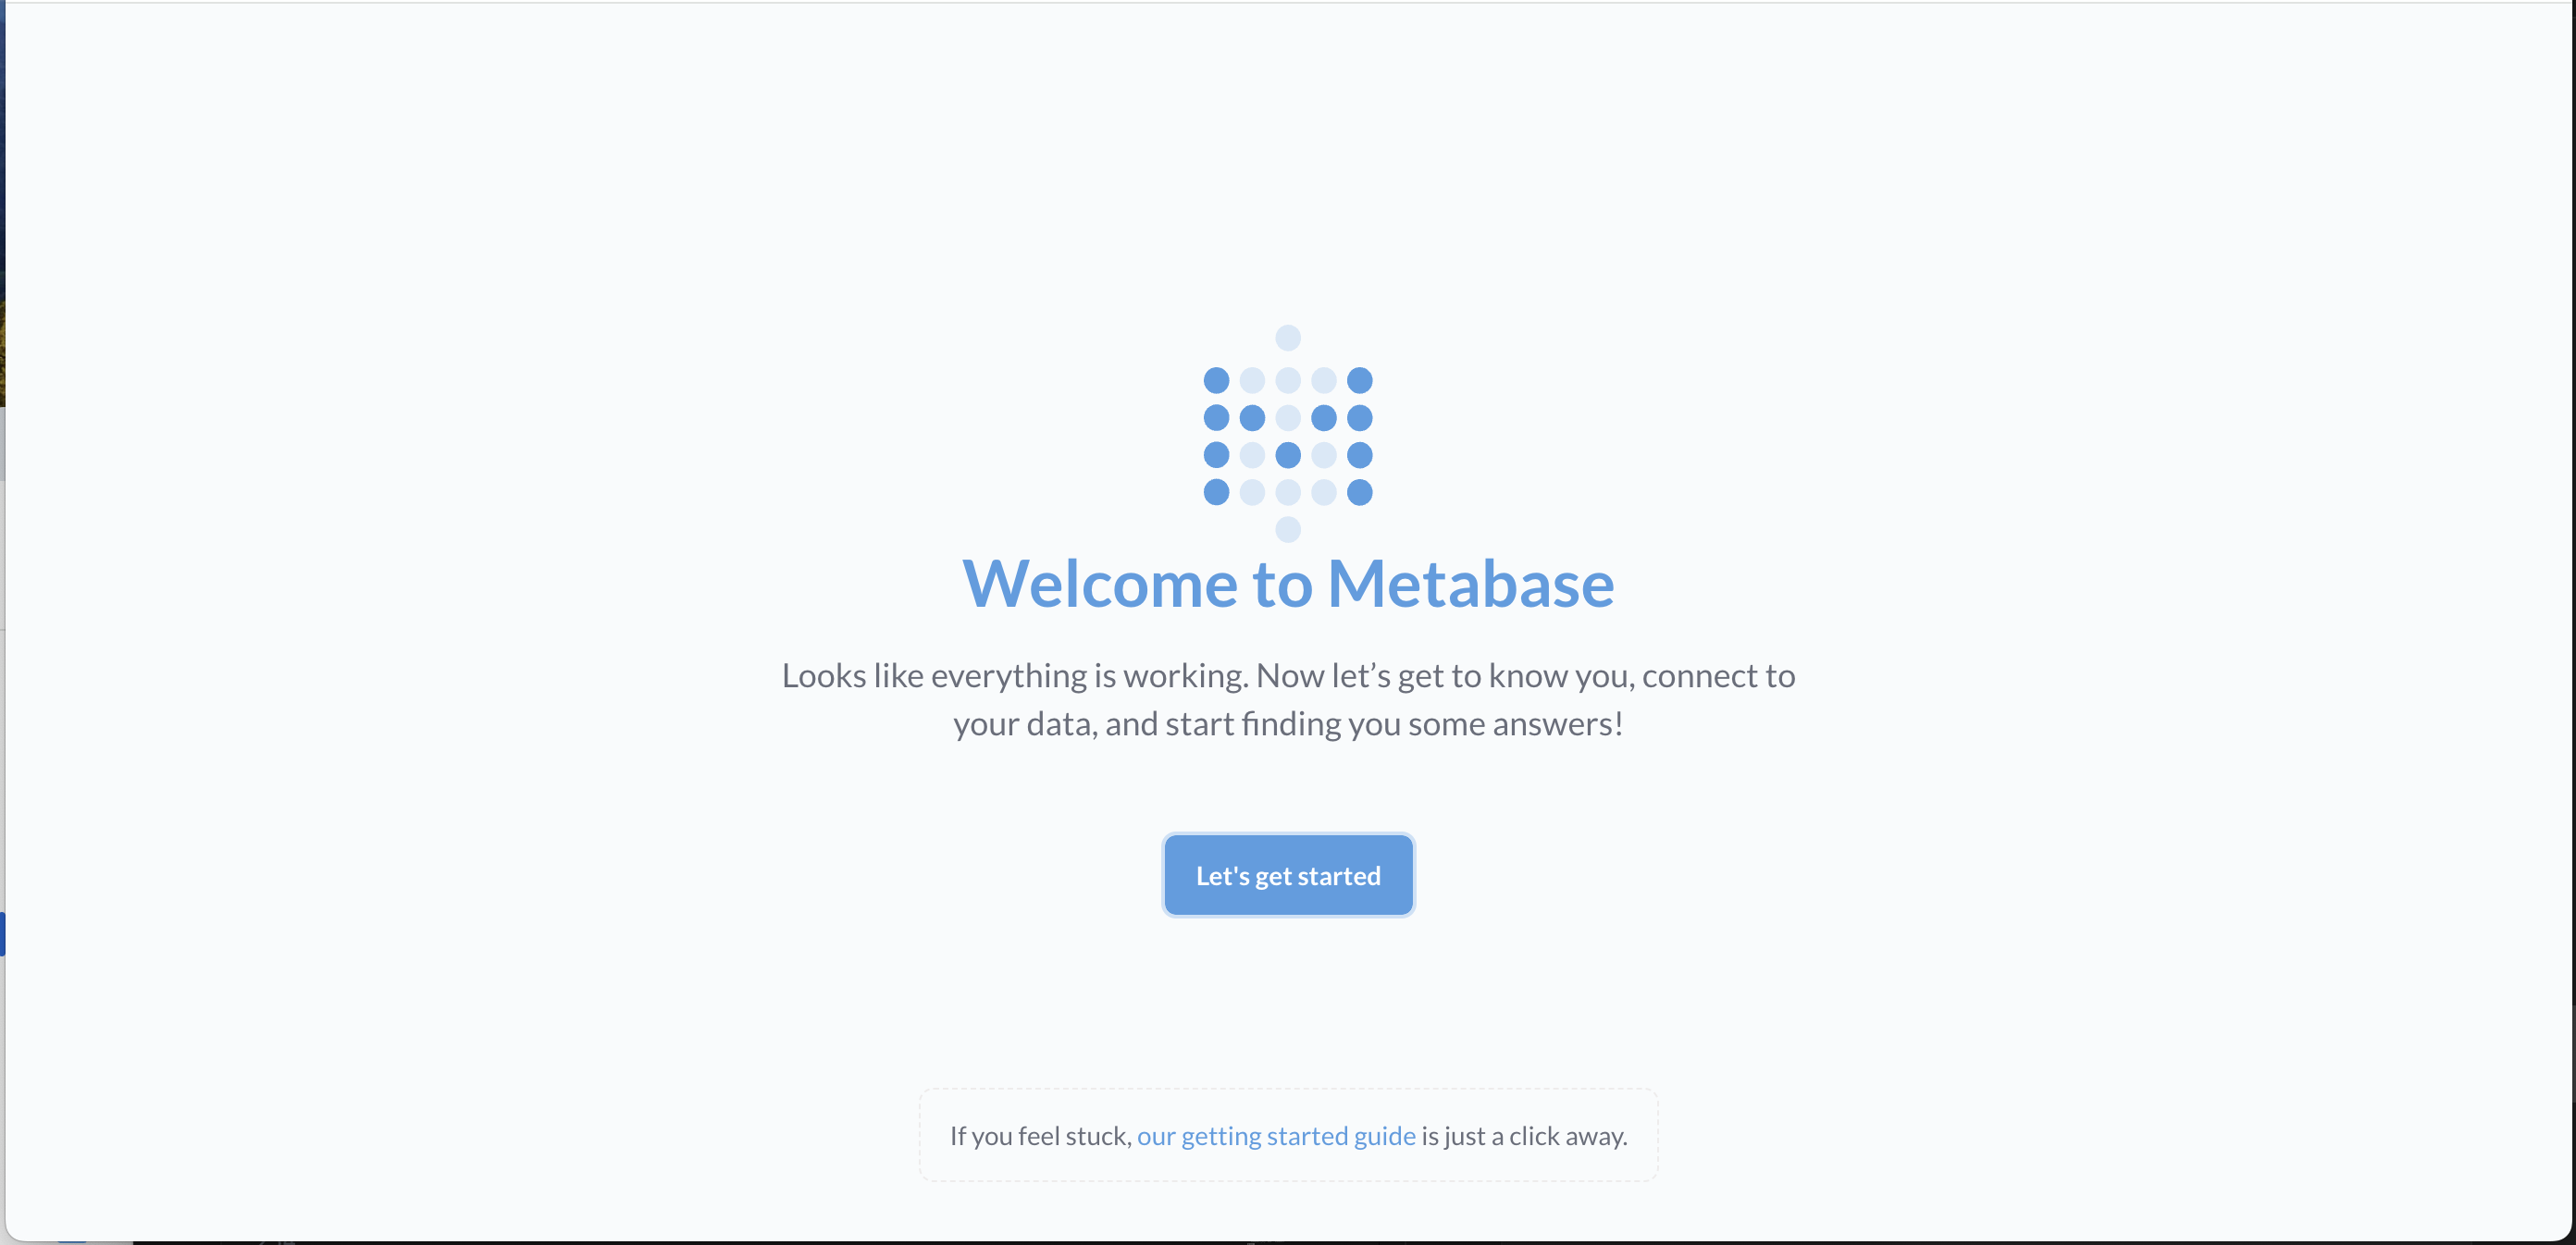
Click Let’s get started and fill in your information. Choose Self-service analytics for my own company when asked what you'll be using Metabase for. Select MySQL for the database and fill in the details below.
Display Name: Sensor Data
Host: sensordb
Database Name: sensor
Username: tolarewaju3
Password: tolarewaju3
Click Connect Database. Click Finish and “Take me to Metabase”.
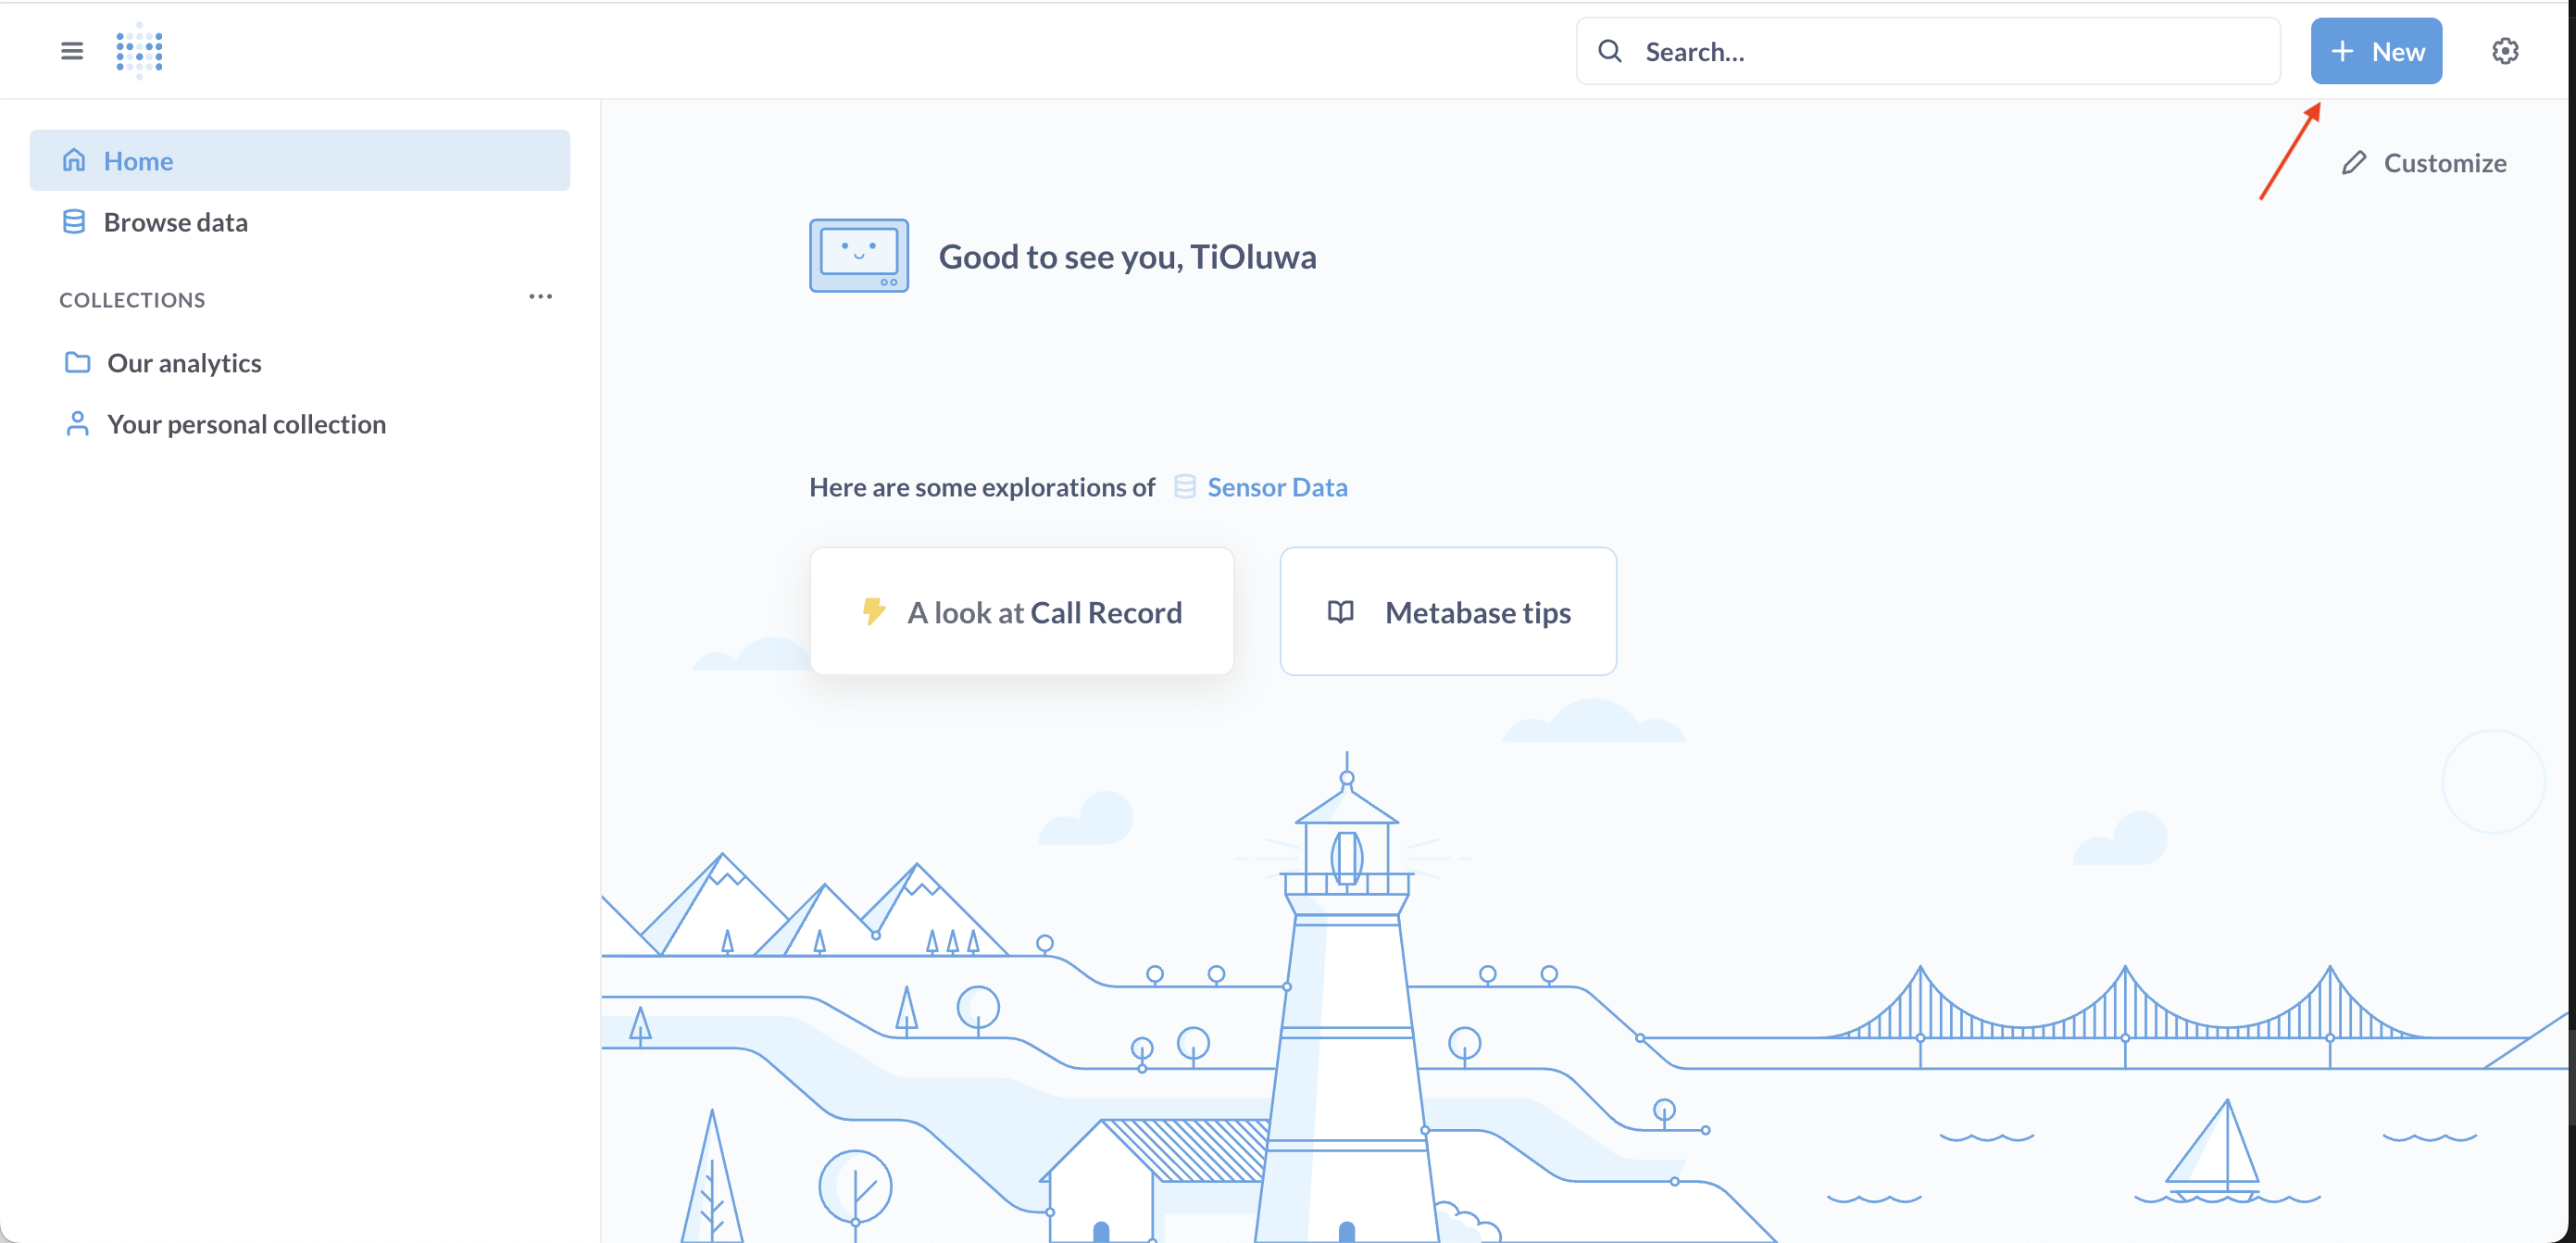
First, we’ll create a new dashboard for our sensor data. In the top right corner, select + New → Dashboard.
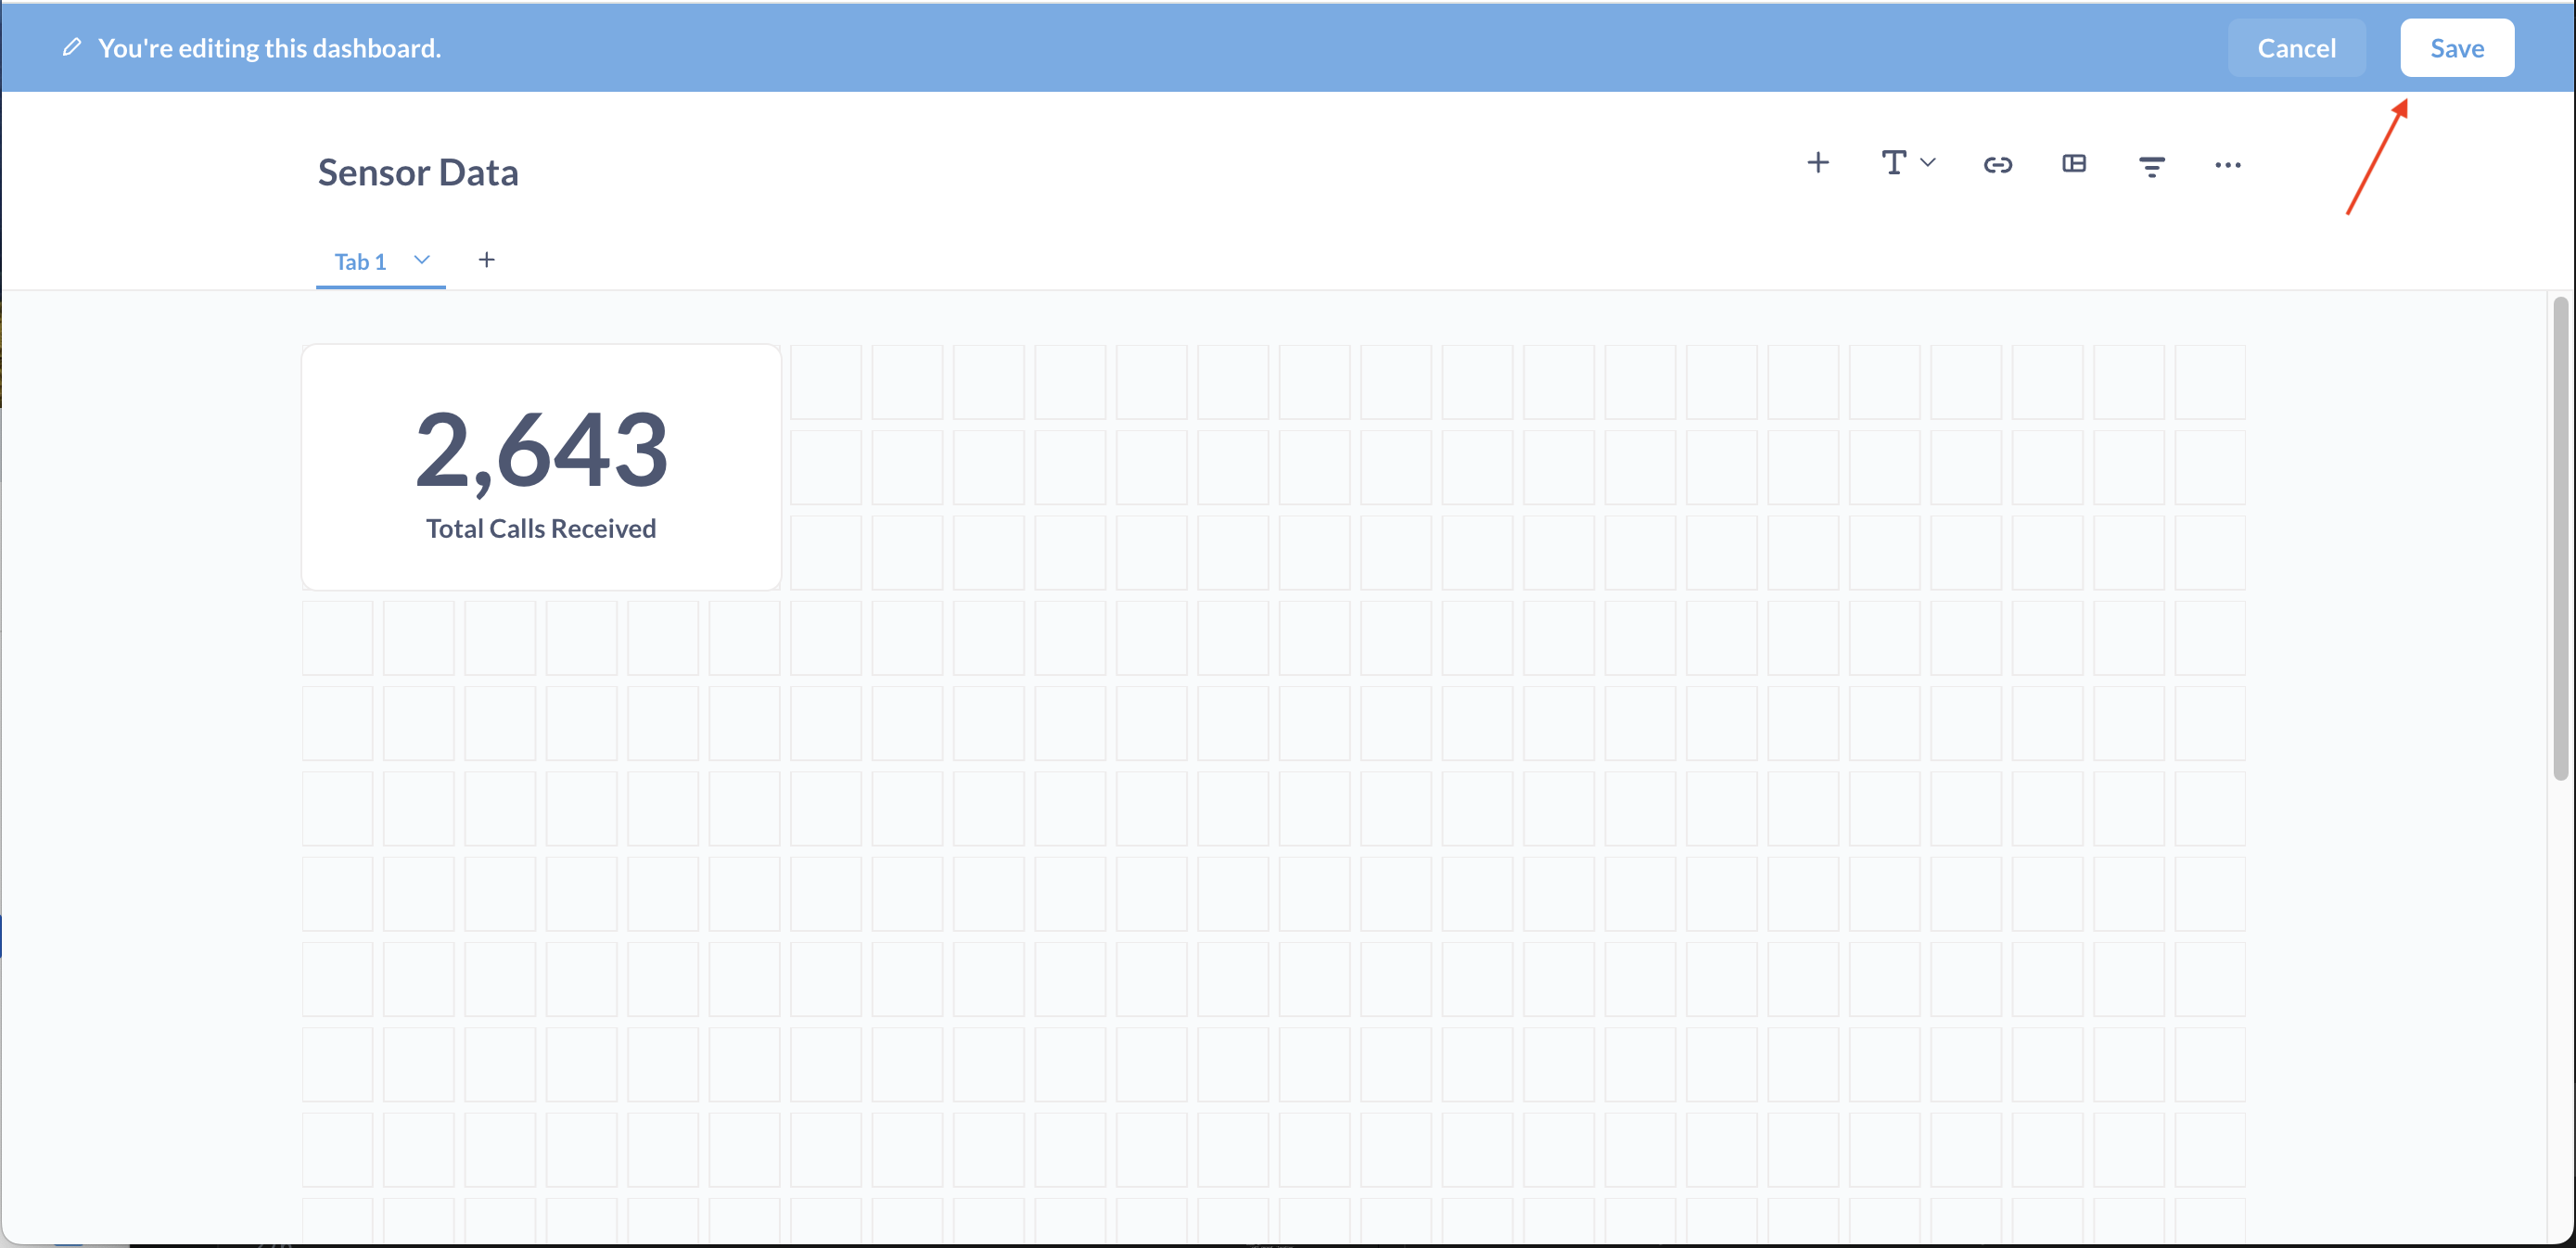
Name the dashboard Sensor Data. Click Create. And click save in the upper right corner.
Next, we’ll display the total calls received on our dashboard. In the upper right corner, click + New → SQL Query. Select our Sensor Data database and enter the query below.
SELECT
  COUNT(*)
FROM
  `call_record`
Click the play button on the bottom right. You should see the number of calls displayed. Hit Save. Name the question Total Calls Received. When prompted to add to a dashboard, select Sensor Data. Click Save.
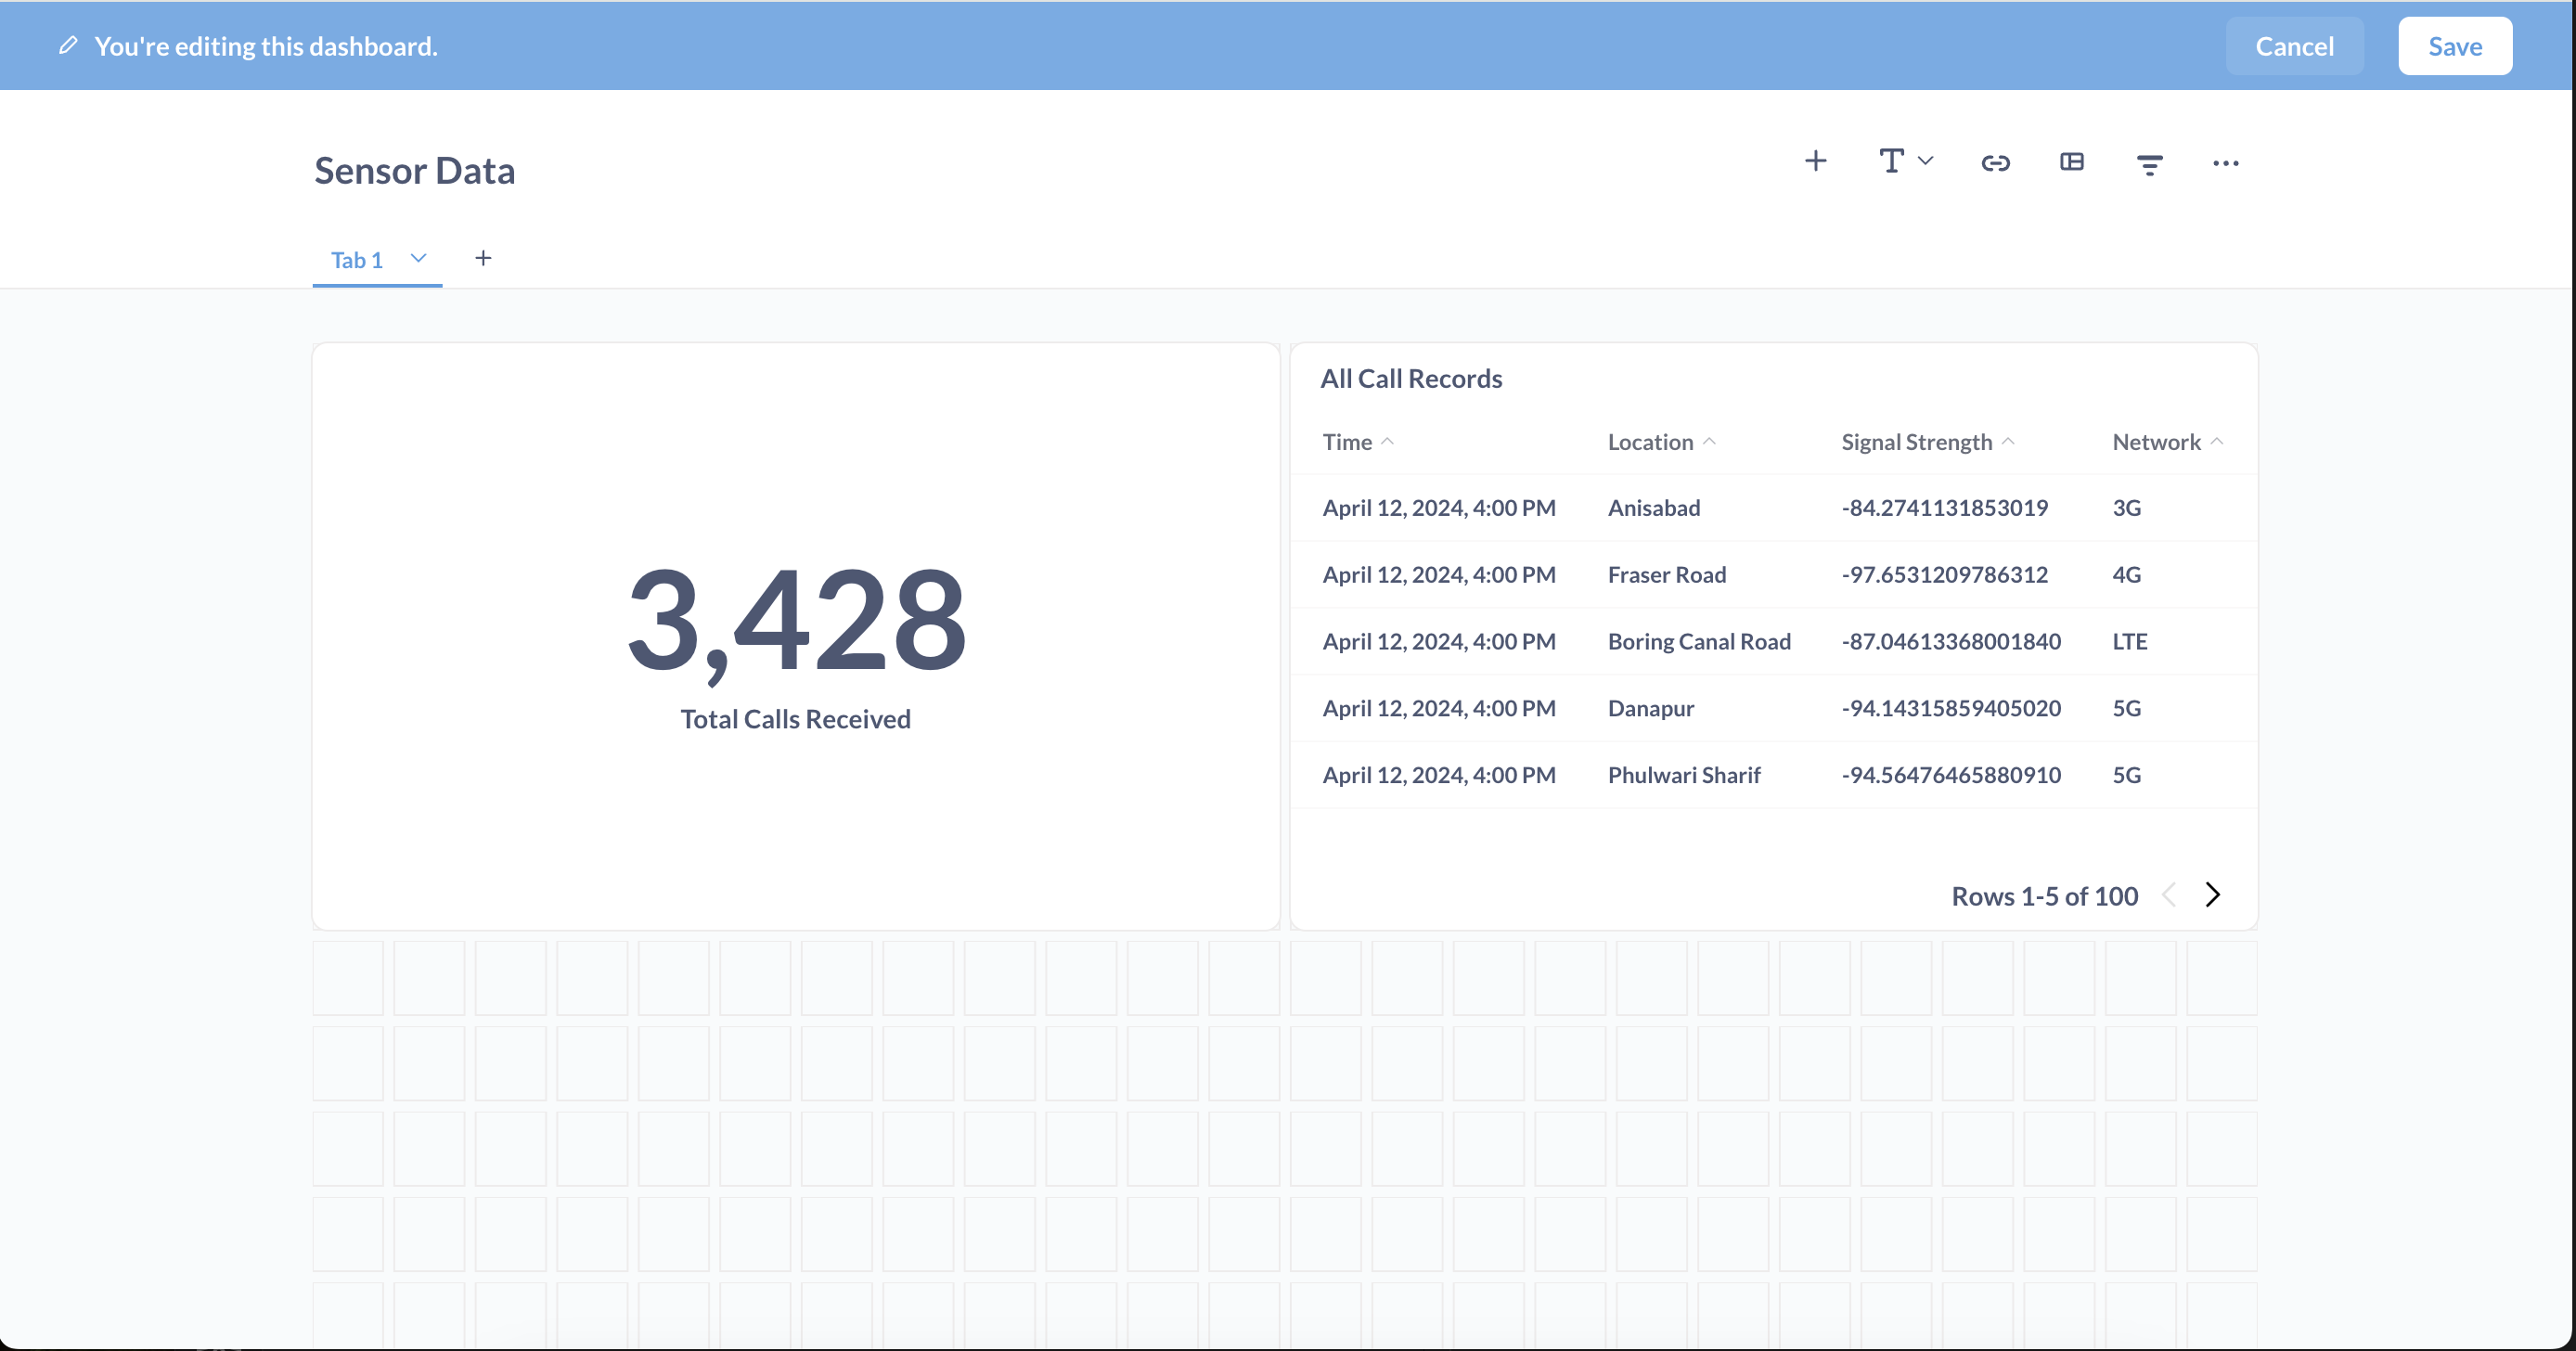
Next, we'll display a table of all calls on our dashboard. In the upper right corner, click +New → SQL Query. Select our Sensor Data database and enter the query below.
SELECT
  `call_record`.`timestamp` AS `Time`,
  `call_record`.`location` AS `Location`,
  `call_record`.`signalStrength` AS `Signal Strength`,
  `call_record`.`network` AS `Network`
FROM
  `call_record`
LIMIT
  100
Click the play button. You should see our call record data displayed in a table. Hit Save and name the question All Call Records. Add the query to the Sensor dashboard. Feel free to resize it make it things look pretty. Click Save again.
Next, add a graph of calls by location. Click +New → SQL Query. Select the Sensor Data database and enter the query below.
SELECT
  `call_record`.`location` AS `location`,
  COUNT(*) AS `count`
FROM
  `call_record`
GROUP BY
  `call_record`.`location`
ORDER BY
  `count` DESC,
  `call_record`.`location` ASC
LIMIT
  10
Click play on the bottom right. Hit the visualization button on the bottom left and select the bar chart. Save the question. Name it Calls by Location and add it to our dashboard. Hit Save.
Finally, we'll display a pie chart of calls by network type. Use the steps above and the query below.
SELECT
  `call_record`.`network` AS `network`,
  COUNT(*) AS `count`
FROM
  `call_record`
GROUP BY
  `call_record`.`network`
ORDER BY
  `call_record`.`network` ASC
Click the play button on the bottom. Select Visualization and choose a pie chart. Save the question and name it Calls by Network Type. When you're done, your dashboard should look like this.
