This is my solution of a task from Prusa Research job interview. It is not perfect nor flawless - it would need a lot of improvemets. If you are looking for an inspiration, it's fine. There is nothing really to copy though. Better to write it yourself :)
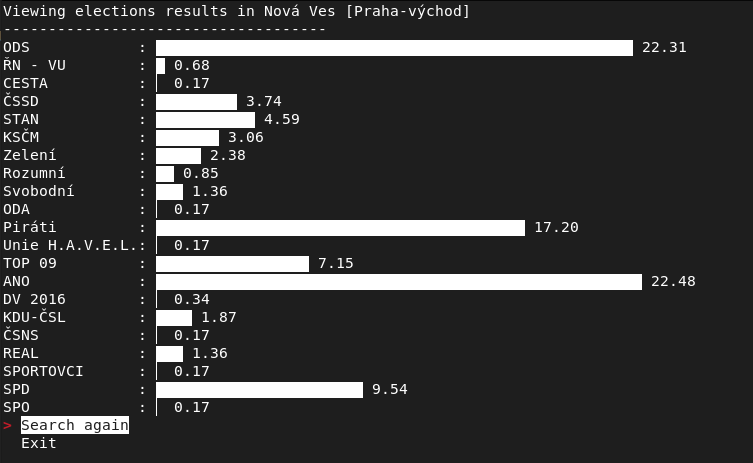
- Napište command line utilitu, která pro zadaný název obce zobrazí barevný graf výsledků voleb.
- Zajímá nás procentní zisk politických stran v rámci dané obce.
- Jako zdroj dat použijte volby.cz
- strojově čitelná data jsou k dispozici tady
- vstup může být interaktivní nebo přes command line argument
- graf postačí sloupcový, nějaký pěkně formátovaný barevný výstup do konzole
- předpokládejme, že data volebních zisků jsou proměnná, jako kdyby byla právě sčítána. Jinými slovy, utilita by měla volební zisky vždy načítat ze stránek volby.cz
- naopak číselník obcí s jejich názvy a kódy můžete považovat za statický
- názvy obcí v ČR nejsou unikátní, v případě zadaní takového jména ať aplikace nechá uživatele interaktivně vybrat tu správnou.
- plus bude, pokud pří opakovaném spuštění pro další obce budou zachované barvy u jednotlivých stran.
- Fetching all the data on the start of the app (not ideal, takes some time to run, but then searching is very fast)
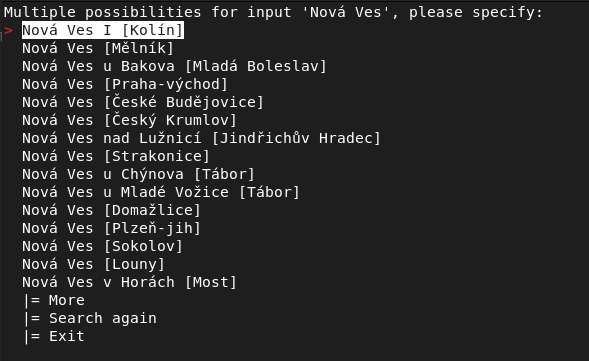
- Able to manage similar named places (e.g. 'Nová Ves') and let user select the right one
- Place could be passed as
--place=Prahaargument (case sensitive, search with diacritics) or typed down to the CLI interface (using simple term menu)
- Plotting the graph using termgraph. Spent a lot of time here, it's more complicated than plot it using plotly (at least for me).
Web interface using streamlit
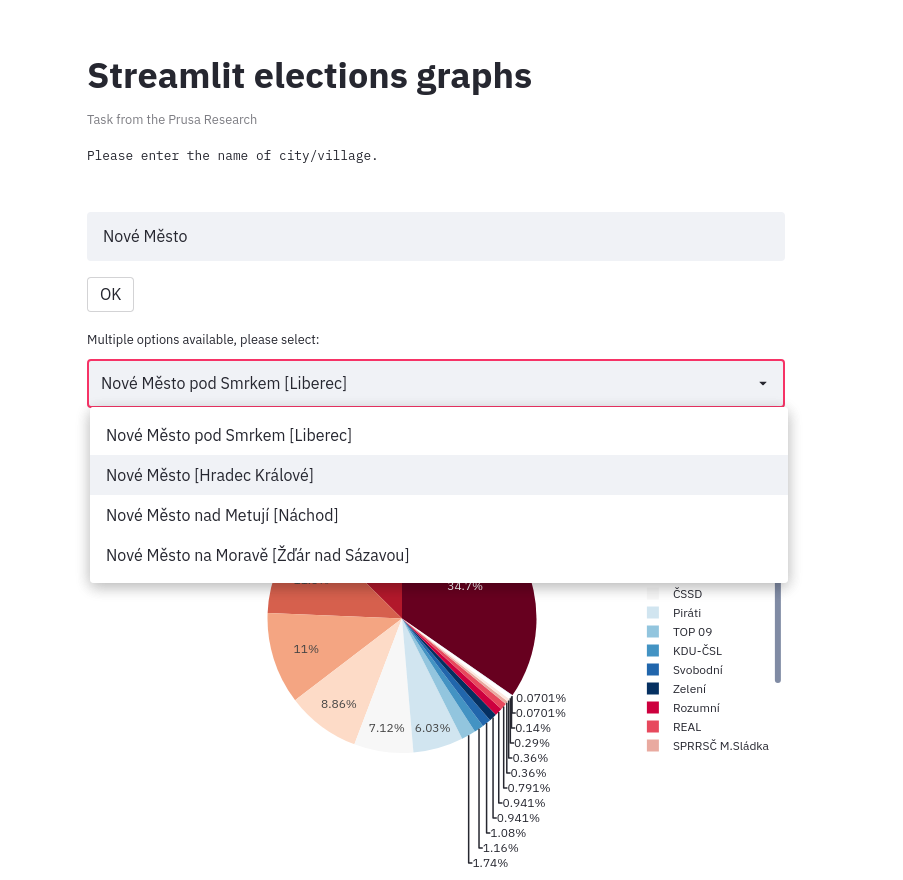
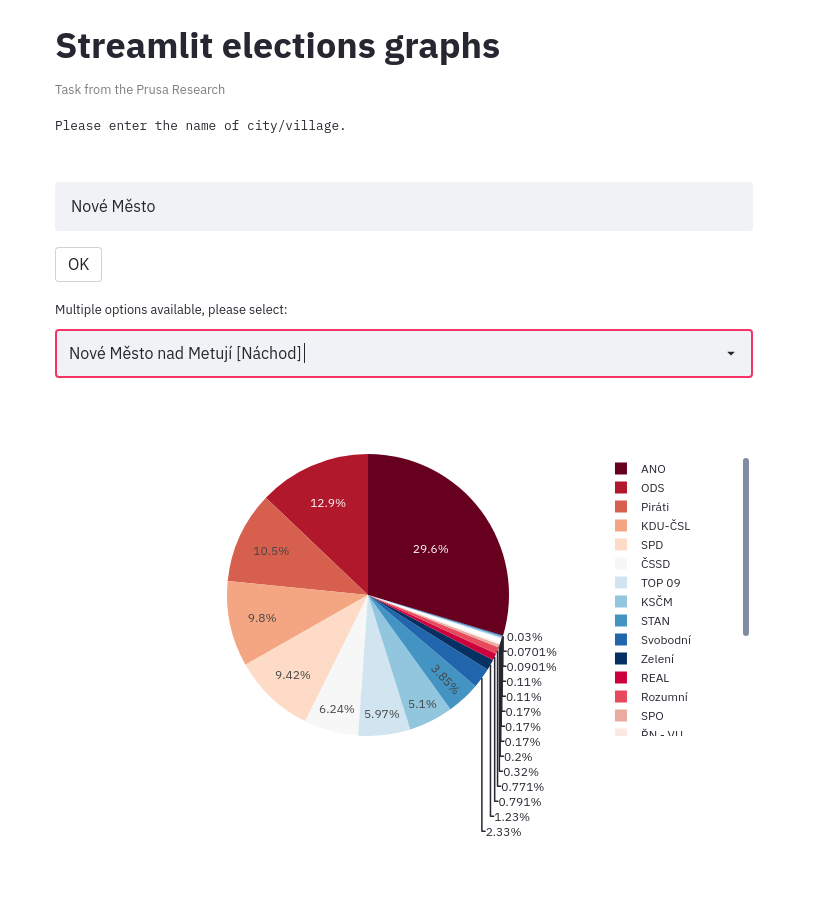
- Running in a web browser, looks better, more intuitive
- Can select from selectbox when multiple options available
- Plotting graph using plotly
- Clone/download (and unzip) this repo to your computer
- Open terminal and navigate to the directory where you clonned/extracted the repo
- execute
pip install -r requirements.txtto install dependences
python ./main.py                 # for command line version
python ./main.py --streamlit # for web version 


