gtk_perfbar
Minor updates to Doug Lea's GTK perfbar application for Linux.
Code originally from http://gee.cs.oswego.edu/dl/code/.
Linux building instructions
$ cat /etc/redhat-release
CentOS release 6.5 (Final)
$ sudo yum install gtk2-devel
$ sudo yum install gtk2
$ sudo yum groupinstall "Development Tools"
[...Output not interesting...]
$ make
gcc -O -DLINUX -pthread -I/usr/include/glib-2.0 -I/usr/lib64/glib-2.0/include -I/usr/include/gtk-2.0 -I/usr/lib64/gtk-2.0/include -I/usr/include/atk-1.0 -I/usr/include/cairo -I/usr/include/pango-1.0 -I/usr/include/pixman-1 -I/usr/include/freetype2 -I/usr/include/libpng12 -pthread -lgtk-x11-2.0 -lgdk-x11-2.0 -latk-1.0 -lgio-2.0 -lpangoft2-1.0 -lgdk_pixbuf-2.0 -lpangocairo-1.0 -lcairo -lpango-1.0 -lfreetype -lfontconfig -lgobject-2.0 -lgmodule-2.0 -lgthread-2.0 -lrt -lglib-2.0 -o linux_perfbar perfbar.c
Now you have a linux_perfbar binary.
Linux running instructions
-
Login to the target host you want to monitor. (Skip this step if you are already on the host of interest.)
$ ssh -X username@hosthame
(If your X session information isn't forwarded properly and the DISPLAY environment variable isn't setup, you probably need to install xauth on the target host.$ sudo yum install xauthon the target host and then logout and re-login.) -
Start perfbar.
$ ./linux_perfbar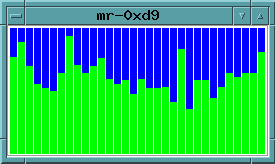

How to interpret perfbar
- Each vertical bar represents one CPU in /proc/stat
- If hyperthreading is enabled, each hyperthread counts as one CPU
- Blue is idle time
- Green is user time
- Red is system time (i.e. in the kernel)
- White is other time (i/o time and nice time)
Implementation notes
- The function get_times() is system-specific. This is where Linux /proc/stat is read.
- /proc/stat contains monotonically increasing tick counts for each CPU
- See http://www.linuxhowtos.org/System/procstat.htm for /proc/stat documentation
- The display is updated 5 times a second, and would appear very jagged if the raw data were displayed. A smoothing function is applied to assist visualization.
Miscellaneous
It's worth pointing out that a linux_perfbar built on Centos 6.5 runs fine on this version of Ubuntu.
$ cat /etc/lsb-release
DISTRIB_ID=Ubuntu
DISTRIB_RELEASE=12.04
DISTRIB_CODENAME=precise
DISTRIB_DESCRIPTION="Ubuntu 12.04.5 LTS"