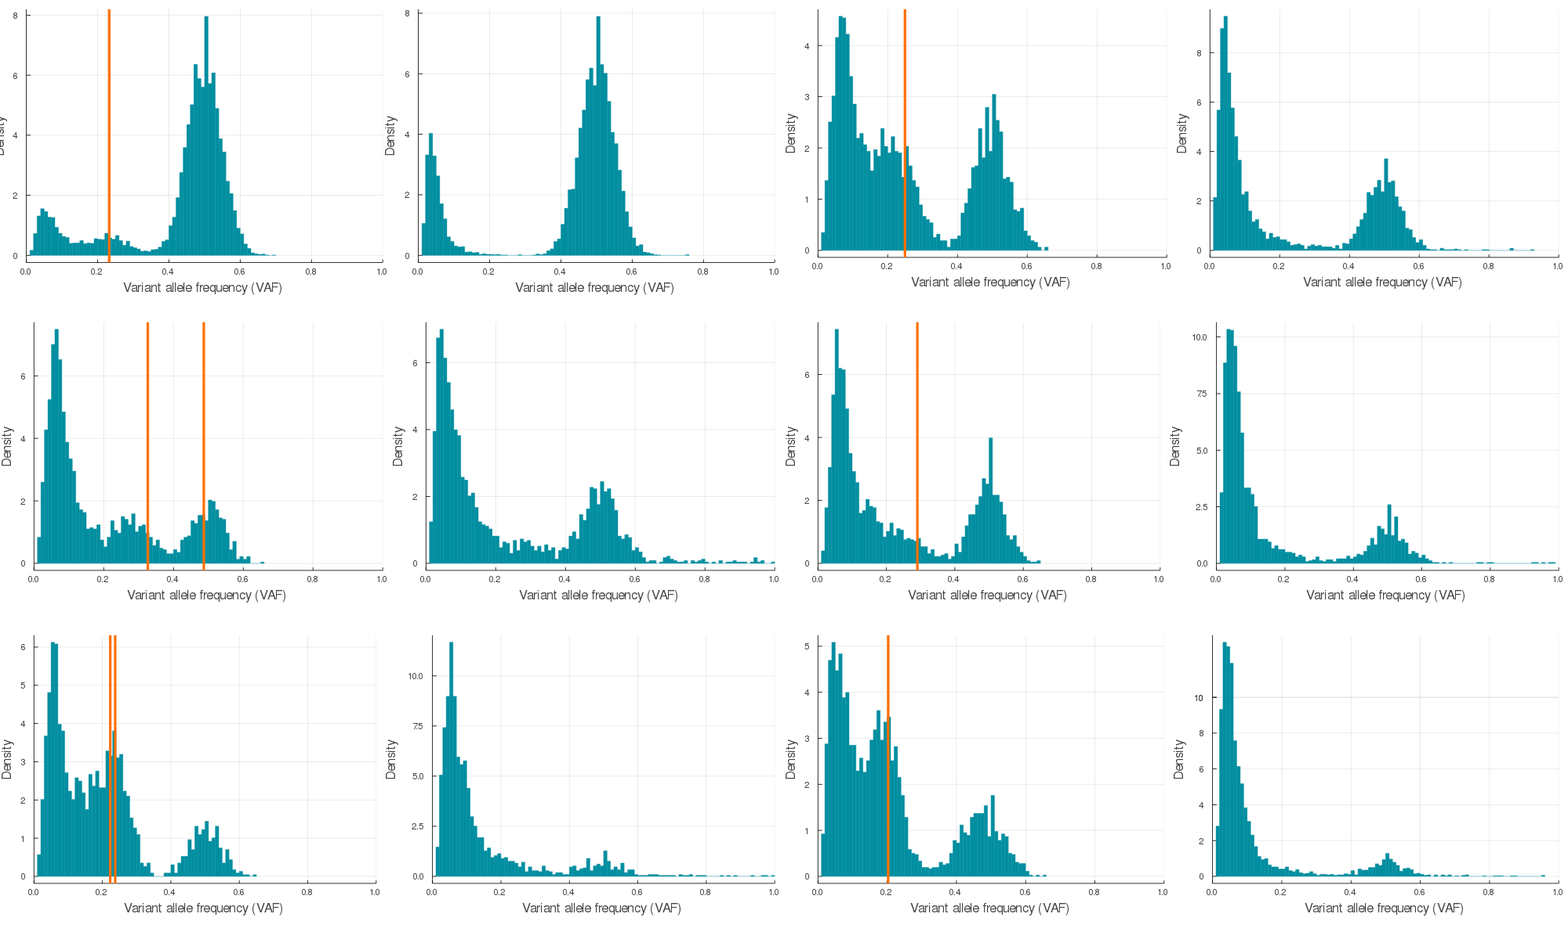
This julia package is used to generate realistic variant allele frequency (VAF) distributions that are observed in bulk-sequenced single tumour biopsies. We use stochastic simulations to generate tumour poulations with subclones/driver haplotypes under positive selection. In addition, to avoid spurious subclones that arise due to genetic drift in computationally feasible, but small, population sizes, we use a fully synthetic generative process to create neutral VAF distributions based on sampling from a Pareto distribution. We also integrate feature engineering functions to convert the VAF distribution into deep learning friendly data structures for evolutionary inference. For deep learning applications using this synthetic data, please see TumE
First download the repository locally
git clone https://github.com/tomouellette/CanEvolvethen to run, open a Julia REPL or build a script with the following
using Pkg
Pkg.activate("[your/path/to/CanEvolve.jl]")
using CanEvolveWe provide a fast synthetic data generator that randomly samples empirically realistic simulation parameters from pre-specified uniform distributions (see sampleParameters function in /src/automation). The autoSimulation function will then generate synthetic VAF distributions from a tumour under positive selection and from a parameter matched neutral synthetic tumour.
This call to autoSimulation simulates tumours at a birth rate = 1 and death rate = 0.1, and ensures the tumour subject to positive selection has at least 1 or 2 subclones between 10 - 40% VAF (20 - 80% cellular fraction). Note that additional subclones up to ndrivers-1 can be at frequencies above or below the cutoffs.
Pkg.activate(".") # Running from source directory
using CanEvolve
p, n = autoSimulation(1, 0.1, nsubclone_min = 1, nsubclone_max = 2, lower_cutoff = 0.1, upper_cutoff = 0.4)
To visualize the VAF distribution for the positively selected (p) and neutrally evolving (n) tumours, run plotVAF.
using Plots
plot(plotVAF(p, bins = 100), plotVAF(n, bins = 100), layout = 2)
Here is a sample of 20 auto simulations at 120x sequencing depth (see /img/gif_maker.jl). The vertical orange lines identify the subclone(s) VAF in the p VAF distribution (left).

If you would like to convert synthetic VAF distributions into a usable input for inference, just run engineer on autoSimulation output p.
# Segment the VAF distribution into 64 and 128 bins that are normalized by maximum value
features, labels = engineer(p, k = [64, 128])

# Segment the VAF distribution into 64 and 128 bins of non-normalized mutation counts
features, labels = engineer_un(p, k = [64, 128])This package makes use of the rKMC simulation algorithm from the CancerSeqSim.jl framework developed by Marc Williams. In addition, we generate neutral synthetic data using a Pareto distribution with shape and scale parameters retrieved from PCAWG fits by Caravagna et al., 2020.