Generate heatmap pictures from gpx data, optional strava downloader.
- Run download.py to get your strava gpx data
- Use the
--quickoption if you've run it before and just want to get your latest activities
- Use the
- Run draw.py to create some pictures
- You can either cluster by common location, enter a lat-lon pair, use your current location (by ip), or plot all tracks
-
./draw.py cluster --activity-type 9: -
./draw.py cluster --line-color cmap:terrain --activity-type 9 --line-alpha .5- if the line color has the form
cmap:<name>the color map name after the colon will be used. the color level will be determined by the each track's altitude information normalized to the min and max values over all tracks 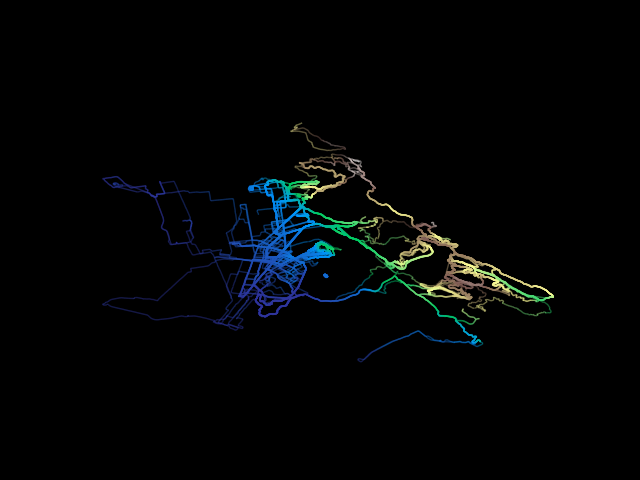
- if the line color has the form
-
./draw.py cluster --line-color lcmap:plasma --activity-type 9 --line-alpha .5:- if the line color has the form
l(ocal)cmap:<name>the color map name after the colon will be used. the color level will be determined by the altitude information normalized to the min and max values of each individual track 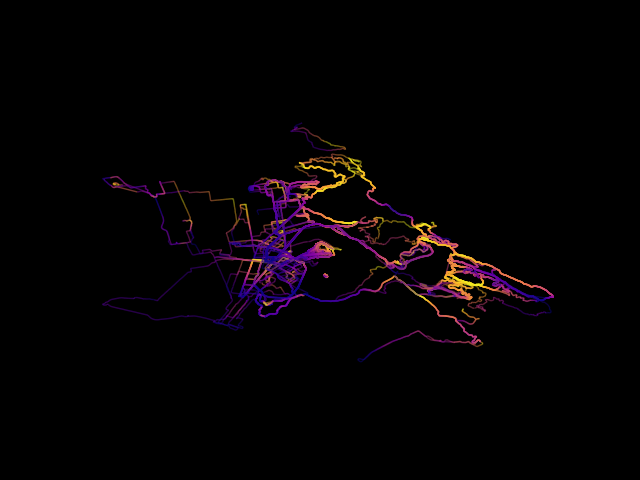
- if the line color has the form


for available colors look at the
named colors page
or use a color from the xkcd color survey
with --<target>-color xkcd:<color name>. for colormaps look
here