Warning: This code is provided as-is — it is not meant to be executed verbatim. No support is provided in any way.
This repository contains the code for the components in the Kubernetes cluster for toot.community.
We are providing this code for transparency and to allow others to learn from it; however, it is not meant to be executed verbatim. It is not meant to be a "how to" guide but rather a "what we do" guide. The toot.community cluster is connected directly to this repository. Any changes to the code in this repository will automatically deploy to the cluster through ArgoCD.
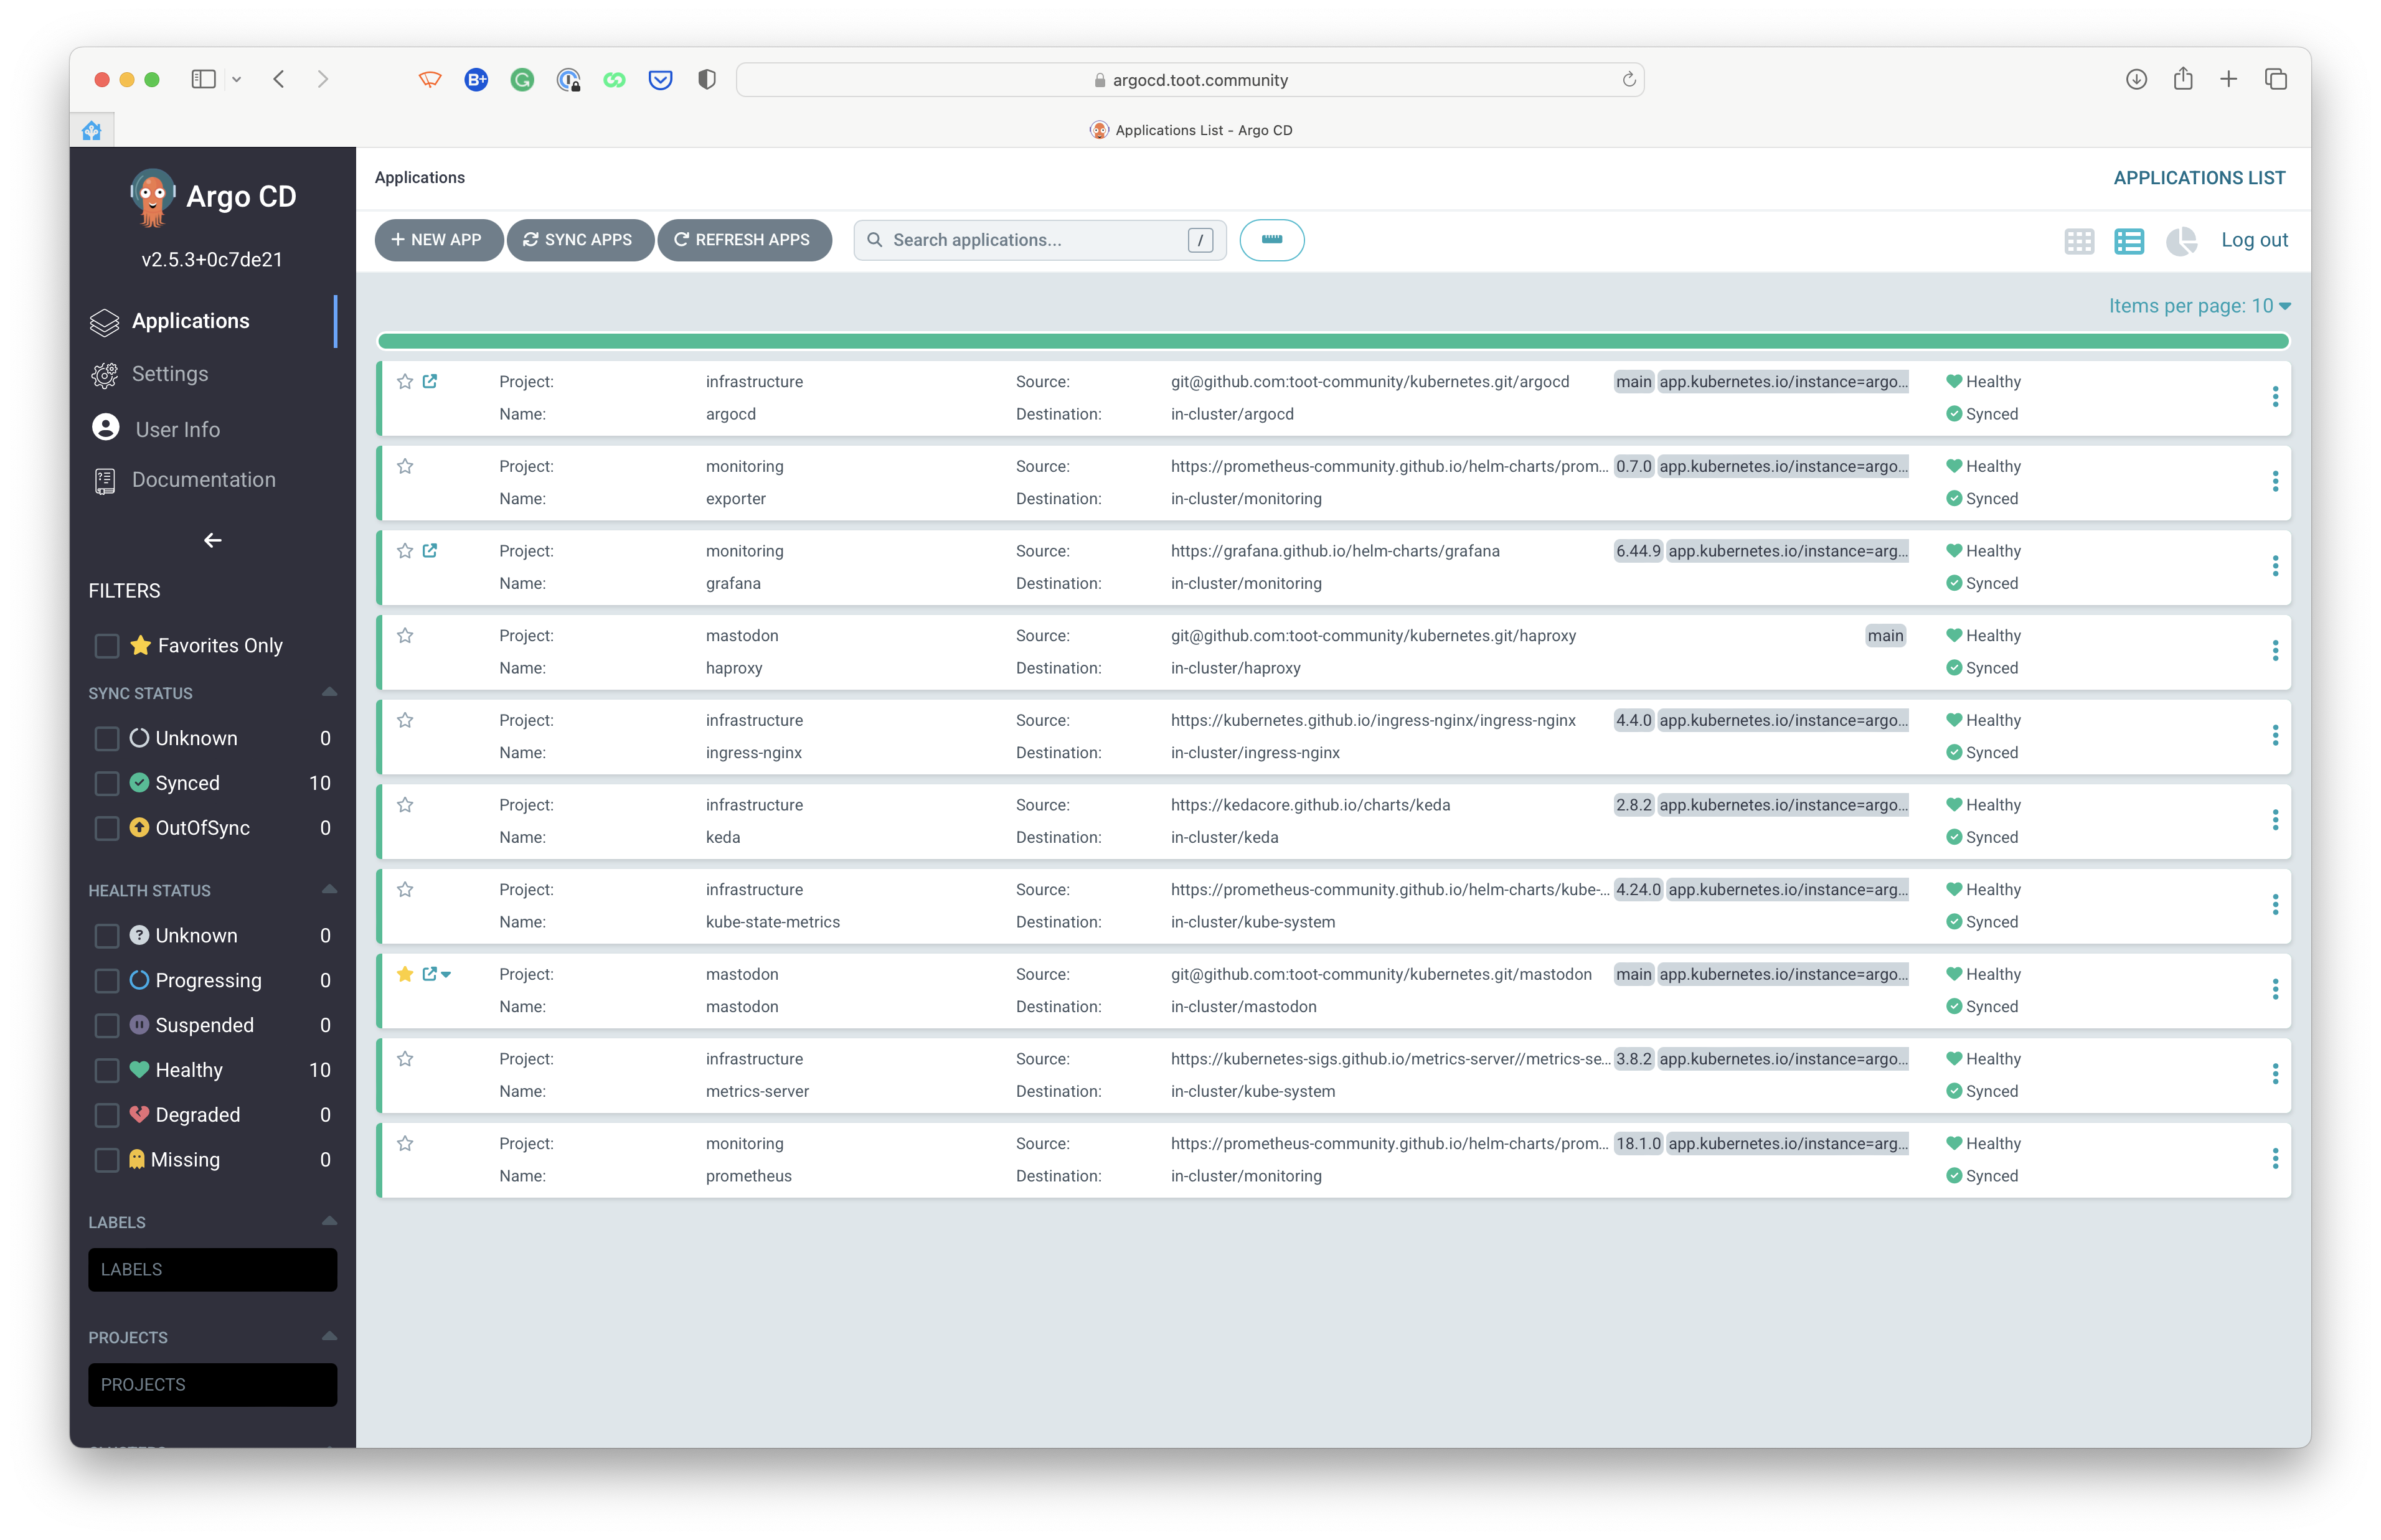
Application definitions, configurations, and environments should be declarative and version controlled. Application deployment and lifecycle management should be automated, auditable, and easy to understand. Argo CD follows the GitOps pattern of using Git repositories as the source of truth for defining the desired application state.
ArgoCD manages all the components that are used in our Kubernetes setup through Helm charts, Kustomize or regular manifests.
argocd/: ArgoCD Kustomize base configurationargocd/applications/: ArgoCD applications definitionsargocd/configuration/: ConfigMap patches for configuring ArgoCDargocd/ingress/: Ingress definition for ArgoCDargocd/projects/: ArgoCD projects definitions
Grafana is an open-source, feature rich metrics dashboard and graph editor for Graphite, Elasticsearch, OpenTSDB, Prometheus.
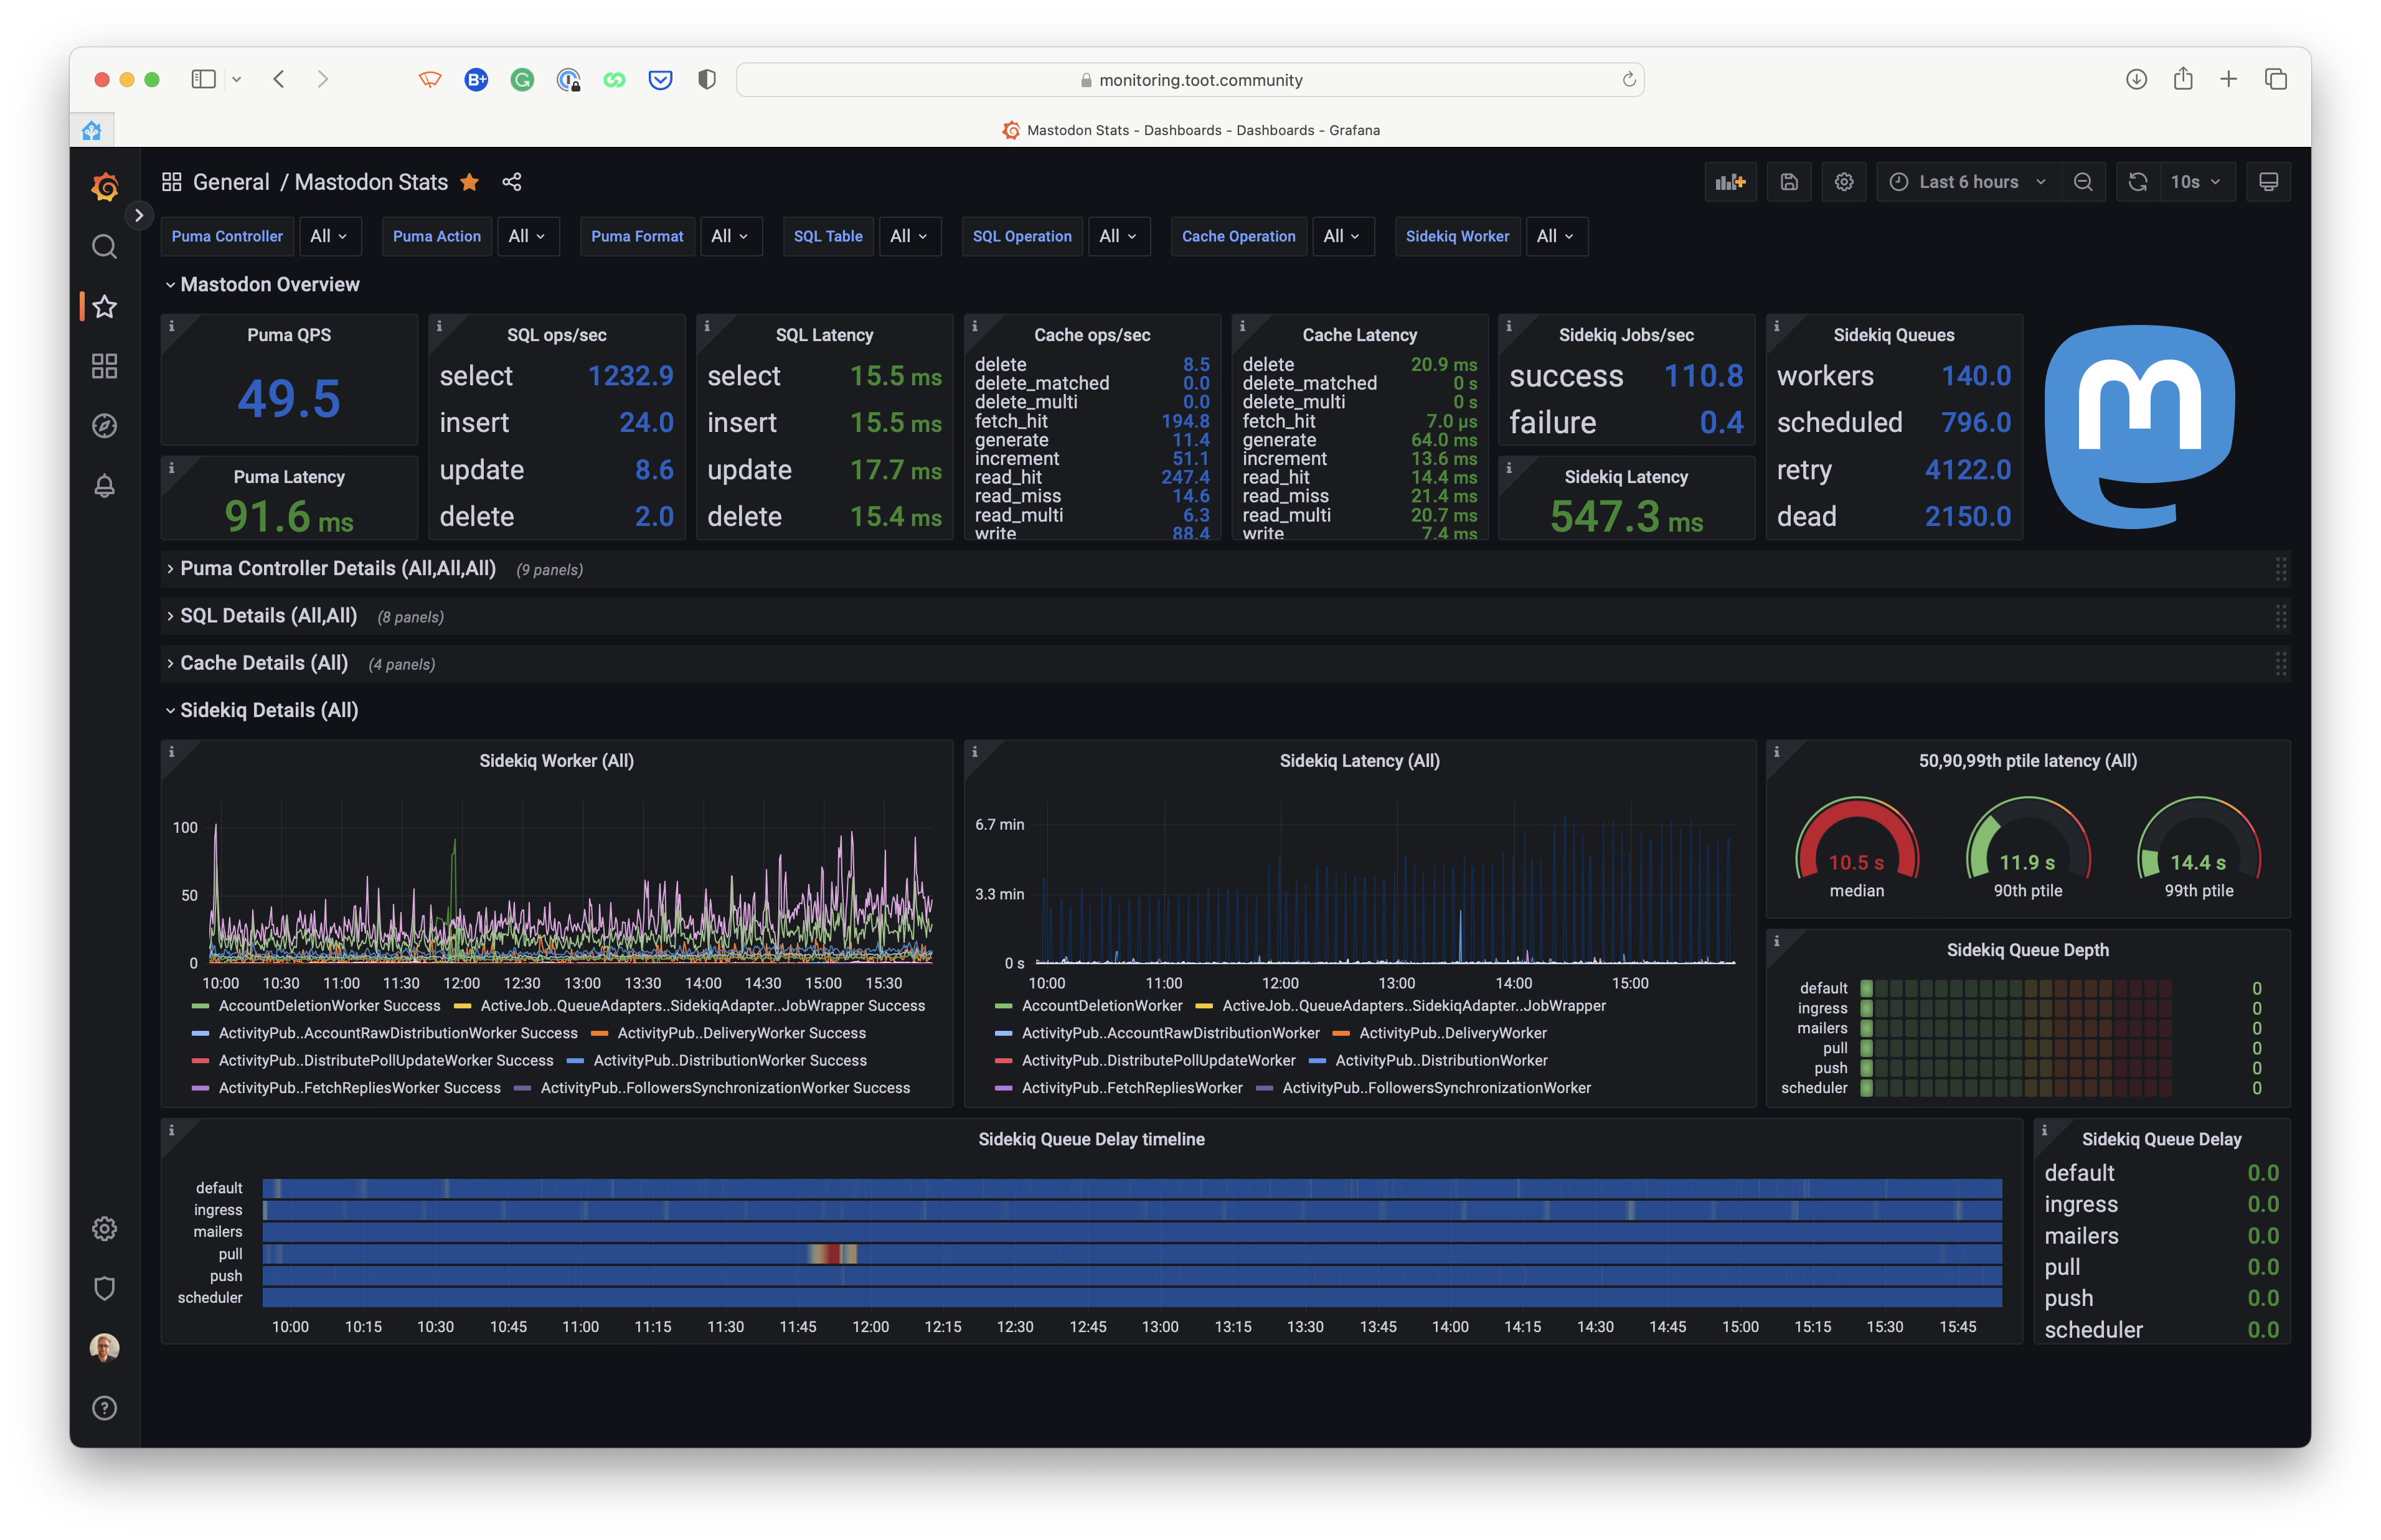
We use Grafana for charting and visualizing metrics from Prometheus. It allows us to inspect critical metrics from NGINX, Mastodon, and other parts of our cluster. Since all components are publicly available, we were able to use the generally available dashboards to consume these metrics.
A unique Mastodon dashboard is made by Pim van Pelt: https://ipng.ch/s/articles/2022/11/27/mastodon-3.html
Other dashboards that we use are:
- https://grafana.com/grafana/dashboards/1860-node-exporter-full/ (Node Exporter)
- https://grafana.com/grafana/dashboards/9614-nginx-ingress-controller/ (NGINX Ingress Controller)
- https://grafana.com/grafana/dashboards/13332-kube-state-metrics-v2/ (Kube State Metrics)
- https://grafana.com/grafana/dashboards/3662-prometheus-2-0-overview/ (Prometheus)
- https://grafana.com/grafana/dashboards/14981-coredns/ (CoreDNS)
- https://grafana.com/grafana/dashboards/14584-argocd/ (ArgoCD)
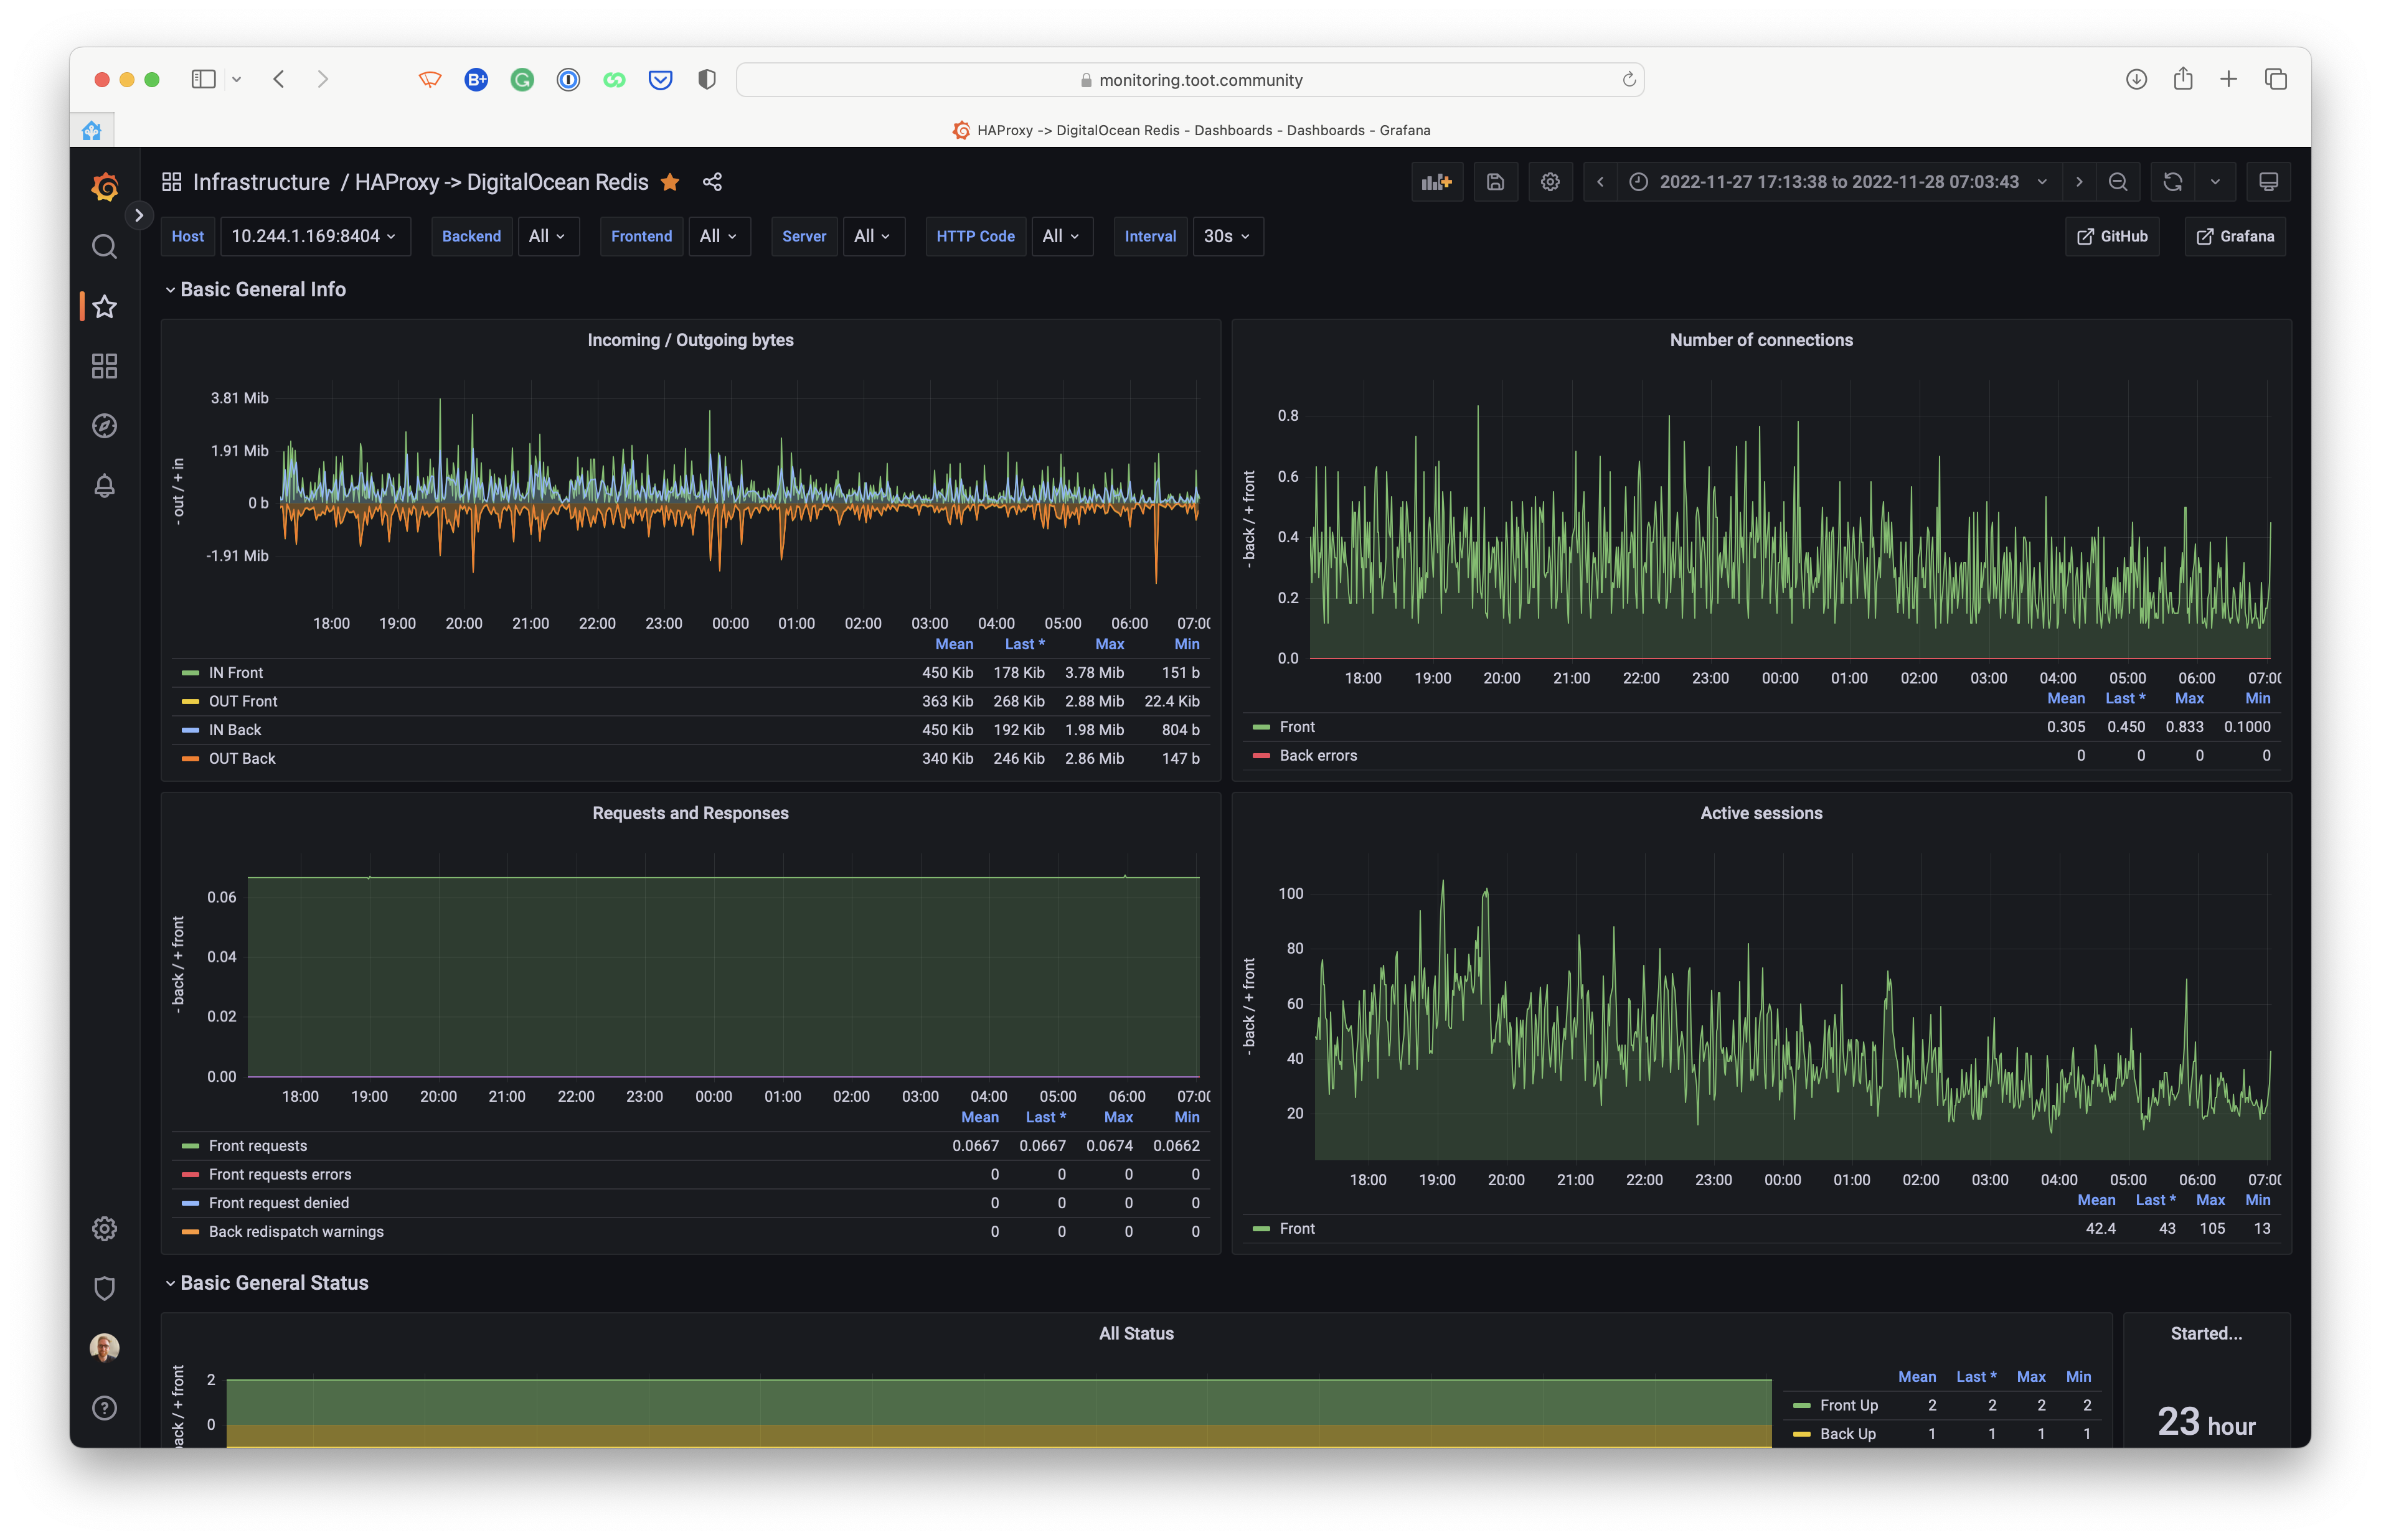
HAProxy is a free, high-speed and reliable solution offering high availability, load balancing, and proxying for TCP and HTTP-based applications.
We use HAProxy as a workaround for the lack of support for Redis TLS in Mastodon. Mastodon and HAProxy are configured in such a way that Mastodon will connect to HAProxy over a TCP connection and HAProxy will then connect to Redis over TLS.
This component will likely be removed in the future when Mastodon supports TLS for Redis. I'm following this issue on GitHub: mastodon/mastodon#19824
The application is configured in ArgoCD using plain manifests. Deployment and (application) configuration can be found
in the directory haproxy/. It's configured to set up a Service on do-redis.haproxy.svc.cluster.local which is used
by Mastodon and spreads the load over all the available HAProxy pods.
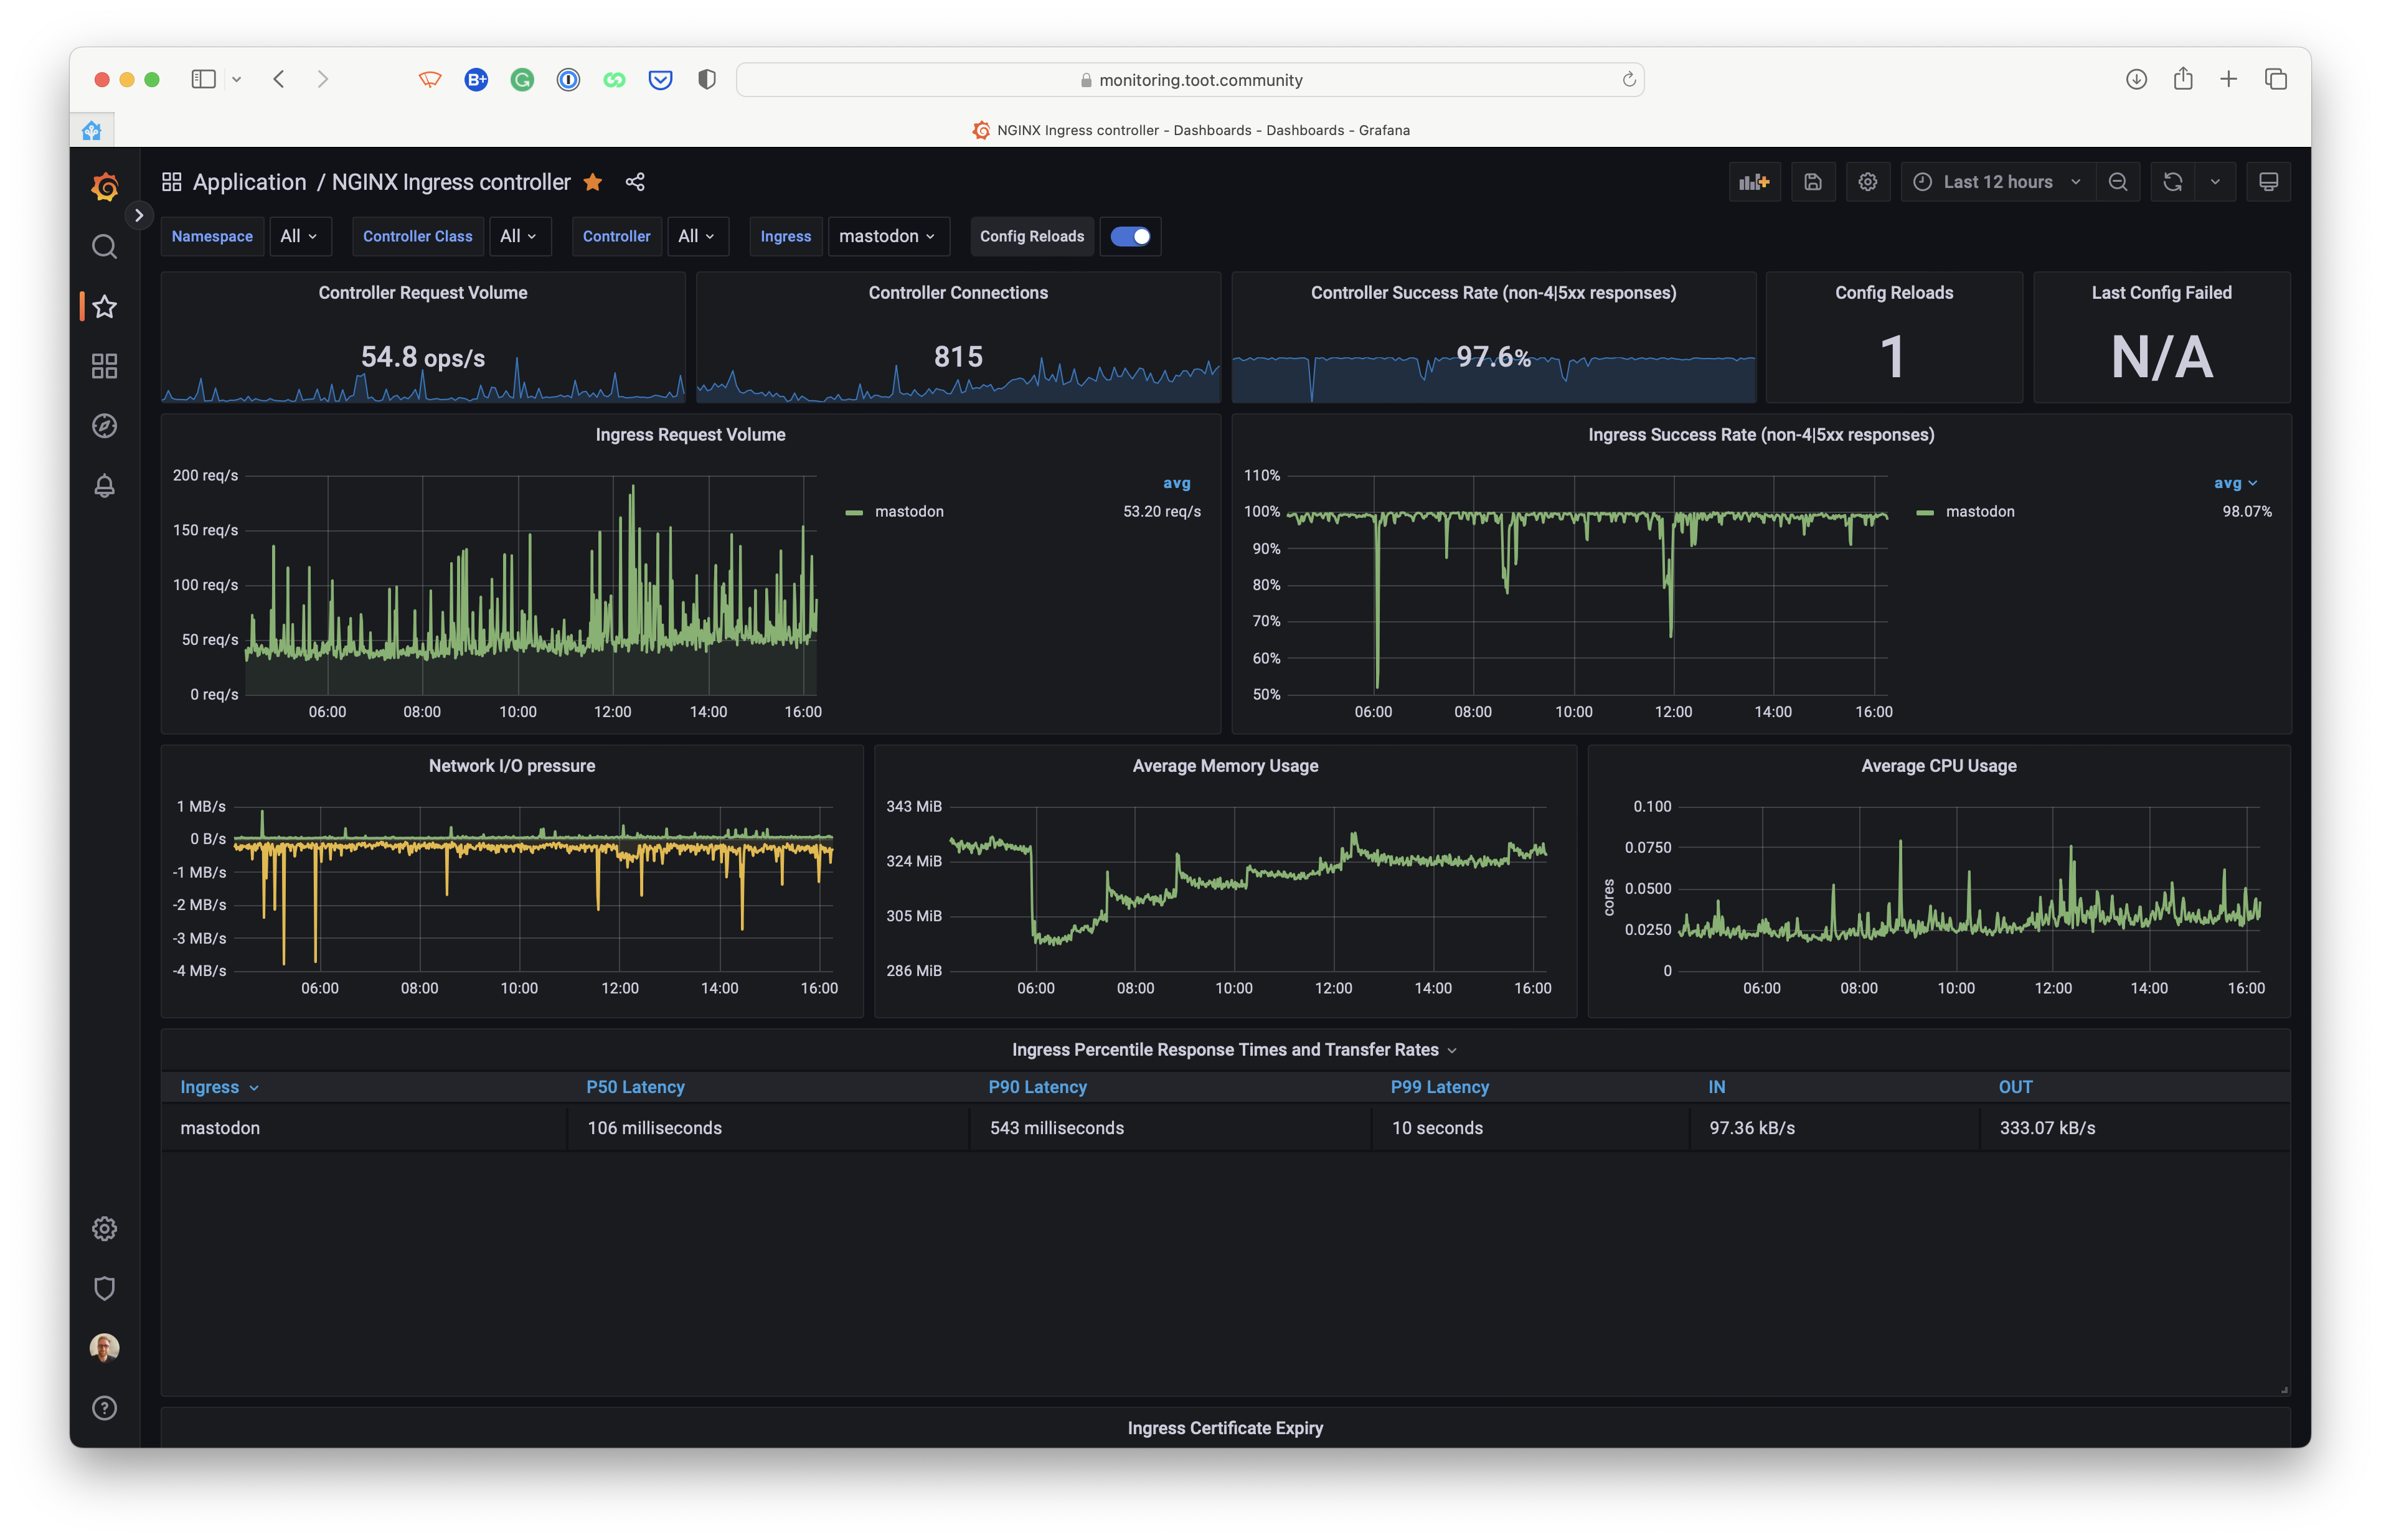
NGINX Ingress Controller is an Ingress controller for Kubernetes using NGINX as a reverse proxy and load balancer.
We use the NGINX Ingress Controller to route traffic to the different services in our cluster.
From an internet-perspective, traffic for toot.community flows as follows:
Internet -> Cloudflare -> NGINX Ingress Controller -> Service -> Pods
KEDA is a Kubernetes-based event-driven autoscaling component. It allows you to define autoscaling rules for containers. KEDA can monitor event sources like Kafka, RabbitMQ, or Azure Event Hubs and can trigger a scale-out (and scale-in) operation.
In our case, KEDA monitors Prometheus and triggers a scale-out when the number of active users on Mastodon is above a certain threshold. More on that in the chapter of scaling.
Kube State Metrics is a simple service that listens to the Kubernetes API server and generates metrics about the state of the objects. DigitalOcean uses it to show detailed graphs about the health of our cluster.
Metrics Server is a scalable, efficient source of container resource metrics for Kubernetes built-in autoscaling pipelines.
Prometheus is an open-source system monitoring and alerting toolkit originally built at SoundCloud. Since its inception in 2012, many companies and organizations adopted Prometheus, and the project has a very active developer and user community.
Prometheus is used to collect metrics from all the components in our cluster. It is configured to scrape metrics from
all Pods containing a specific annotation. In our case, this annotation is prometheus.io/scrape: "true".
Most CNCF components are configured to expose metrics in this way.
Mastodon is an accessible, open-source social network server. It is a decentralized alternative to commercial platforms like Twitter, Facebook, and Instagram. It is based on ActivityPub, an open protocol for decentralized social networking.
Mastodon is the main component of our cluster. It's configured to run on a minimum of two nodes, and it's configured to scale out when the number of active users is above a certain threshold.
You can find all the manifests for Mastodon in the directory mastodon/. It's deploying through ArgoCD.
Scaling Mastodon is a hot topic; many articles are written on how to tune Puma and the Sidekiq workers. We've configured our Kubernetes cluster to automatically scale-up/-down worker nodes based on the number of requested CPU cores and memory. While we monitored usage and adjusted the number of workers, we scale more on the actual use of that time of day. This means that we only pay for the resources we need at that time of day.
The web component of Mastodon is configured to scale out when the number of active users is above a certain threshold. This is done using Prometheus and KEDA. We aren't measuring real active users but the number of requests per second. This is done by using the following Prometheus query:
sum(rate(nginx_ingress_controller_requests{service="mastodon-web"}[1m]))
NGINX Ingress Controller software provides this metric, which exposes Prometheus metrics on the /metrics endpoint.
This will give us the number of requests per second for the last minute. We are using the last minute to be quick on
scaling out. If we used a more extended period, we would be slower scaling out as the average would be crawling up more
slowly.
We're steering the Horizontal Pod Autoscaler (HPA) to target 25 requests per second per Pod. Measurements have shown that 25 requests per second consume about one entire CPU core. This means that we can scale out to about 3-4 Pods per node. Toot.community currently runs on a minimum of 2 nodes, so we have sufficient redundancy. With these two nodes, we can handle a load of up to about 200 requests per second. There's a margin of about 25-50% before the performance starts suffering. This margin allows the Kubernetes Cluster Autoscaler to provision and add more nodes while the traffic increases. Since we can add an unlimited number of worker nodes, we can scale out indefinitely, only limited by the amount of money we're willing to spend.
If for some reason, Prometheus is unavailable, we assume that the requests per second is 200 and the Pods for handling web traffic is set to 4.
Strategically, we are only setting the requests.cpu and requests.memory for the Pods. This ensures there's enough
CPU/memory available for the Pods to run. The limits.cpu and limits.memory explicitly are not set so that the Pods
can use as much CPU/memory as they want, as long as enough is available. This is done to ensure we can fill out the node
as efficiently as possible.
Scaling the workers is a bit more tricky. We've noticed that Sidekiq workers tend to "steal" CPU cycles from the web Pods. This means that the web Pods cannot handle the load as efficiently as possible when many jobs are enqueued. To prevent this, we've configured the workers to be scheduled on a separate, isolated node pool dedicated to Sidekiq, so the web Pods are not competing for CPU cycles with the workers.
The logic scaling is the same as for the web Pods, with the main difference being that we're not scaling on the number of requests per second but on the queue latency. The queue latency is the time it takes for a job to be processed. We're using the following Prometheus query to measure the queue latency:
sum(mastodon_sidekiq_queue_latency{queue="default"} * scalar(kube_deployment_status_replicas{deployment="mastodon-sidekiq-default"}))
This will give us the total queue latency for all the jobs in the default queue. We're multiplying this by the number
of active deployments running the default queue. The HPA will divide the returned value back by the number of active
Pods back since the configured target metric should be per-Pod.
We're running on a type of water-mark strategy where we increase the number of running workers on a specific queue as fast and early as possible, but it's slower to scale back down again when the latency is low enough. Our strategy is to scale out when the queue latency exceeds 5 seconds. Sidekiq traffic tends to be spiky throughout the day so not scaling back down too down ensures we have plenty of capacity available when the traffic increases again. In practice, it only scales down on more quiet parts of the day.
A typical setup for SSL / HTTPS on Kubernetes is to use a load balancer that terminates the SSL connection and then routes the traffic to the Pods. In most cases, this is typically done using CertManager with a LetsEncrypt ClusterIssuer type:
However, this is not the ideal situation for us because we use Cloudflare as a CDN and load balancer. Cloudflare is responsible for provisioning SSL certificates. The connection(s) between Cloudflare and our Kubernetes cluster are encrypted using a Origin Certificate, allowing a full (strict) type setup.
Authenticated Origin Pulls allows for us cryptographically verify that requests to our origin server come from Cloudflare using a TLS client certificate. This prevents clients from sending requests directly to our origin, bypassing security measures provided by Cloudflare, such as IP and Web Application Firewalls, logging, and encryption.
More information about how we configured this can be found in the directory ingress-nginx/.
For our cluster, we use the 1Password Operator to manage secrets. It's connected to a shared 1Password vault, and whenever we make changes to the secrets in the vault, the operator will update the secrets in the cluster.
Should you choose to fork this repository or use it as a reference, you will need to replace the 1Password Operator with something of your choosing. You can use plain Kubernetes secrets or a different secret management solution such as Hashicorp Vault.
This project is funded by the users of toot.community. If you want to support this project, please have a look over at:
- Ko-Fi: https://ko-fi.com/jorijn (preferred)
- Patreon: https://patreon.com/tootcommunity


