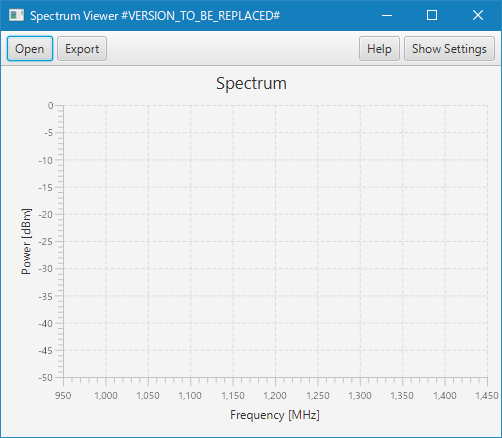
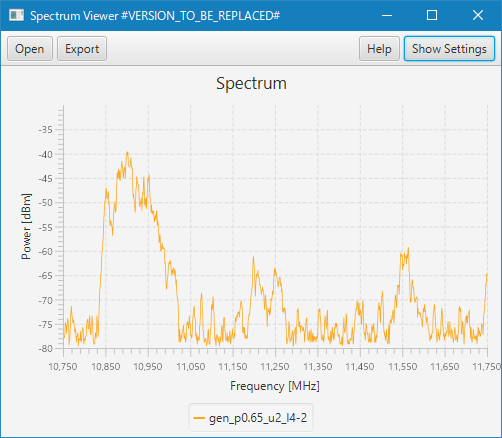
Visualize spectrums as line charts with frequency axis and power axis. The spectrum is read from a binary format file exported by the Satellite Spectrum Monitoring System made by Glowlink Communications Technologies Inc.
This program is written in Java language, and build by JDK 11+ with JavaFX.
- Build by gradle
- Build by IntelliJ IDEA
The build generates an executable module JAR file SpectrumFileViewer.jar.
-
JDKs 11+ with OpenJFX are as follows:
-
Build tools are as follows:
- Gradle wrapper is included in this project.
- IntelliJ IDEA (Community Edition)
- Set PATH to JDK 11+ with OpenJFX javac
- Execute
gradlew buildin command line
- Open from IntelliJ IDEA
- [Build] menu > [Build Project]
D:\work\SpectrumFileViewer> java -p build\libs -m com.torutk.spectrum
- [Run] menu > [Edit Configurations], add new configuration of gradle with task run.
- run the configuration above.
T.B.D.
This program uses Java Util Logging. Logging can be configured by a property file specified by the system property 'java.util.logging.config.file'.
T.B.D.
User interface can be configured by a cascade style sheet file named SpectrumFileView.css
placed in the parent of current directory, or it's sub directory within max depth of 3.
T.B.D.
T.B.D.
This program has a command-line tool for generating test spectrum data file. The generated spectrum data is based on a markov model.
- under build environment, show usage
D:\work\SpectrumFileViewer> java -cp build\libs\SectrumFileViewer com.torutk.spectrum.data.RandomGenerator
Command line usage: -f <file> -p <probability> -u <upper shift> -l <lower shift>
        file: spectrum data file to be generated
        probability: of power increased (0.0 to 1.0) by markov model
        upper shift: amount of power increase in a step
        lower shift: amount of power decrease in a step
- for example, apply probability=0.65 upper shift=2 lower shift=4,
D:\work\SpectrumFileViewer> java -cp build\libs\SectrumFileViewer com.torutk.spectrum.data.RandomGenerator ^
 -f gen_p0.65_u2_l4.dat -p 0.65 -u 2 -l 4

