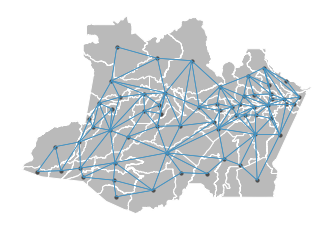
This project generates a graph representation of spatial meshblocks based on distance or neighborhood.
-
Create a .env file, insert an fill the following envirommental variables:
ROOT_DATA= <path to save the data>
-
Create a vitual enviroment and install all packages in requiments.txt.
conda create --name <env> --file requirements.txt
-
Install the project as package.
pip install -e .
-
Configure the parameters in the files:
├── data ├── parameters.json ├── switchers.json -
Run src/main.py
python src/main.py
Description of the parameters needed to execute the code.
- global: General parameters
- region: The name of the region (Ex: Brazil)
- org: The name of the federal agency
- year: The election year
- aggregation_level: Geographical level of data aggregation
- meshblocks: parameters regarding the meshblock data
- data_name The name of the data (Ex: meshblocks)
- id_col The identification column
- renamed_id_col: The new name of the identification column [Optional]
- type_adj The type of graph (QUEEN or INVD)
- meshblocls: switchers regarding the locations pipeline
- raw: switch to run the raw process (0 or 1)
- processed: switch to run the processed process (0 or 1)
    ├── LICENSE
    ├── README.md          <- The top-level README for developers using this project.
    ├── requirements.txt   <- The requirements file for reproducing the analysis environment, e.g.
    │                         generated with `pip freeze > requirements.txt`
    │
    ├── setup.py           <- makes project pip installable (pip install -e .) so src can be imported
    ├── src                <- Source code for use in this project.
    │   ├── __init__.py    <- Makes src a Python module
    │   ├── data.py    <- Data abstract class
    │   ├── pipeline.py    <- Pipeline class
    │   ├── main.py    <- Main function
    │   │
    │   ├── meshblocks           <- Scripts to process meshblock data
    │   │   └── raw.py
    │   │   └── preocessed.py
    │   │
    ├────
Project based on the cookiecutter data science project template. #cookiecutterdatascience
