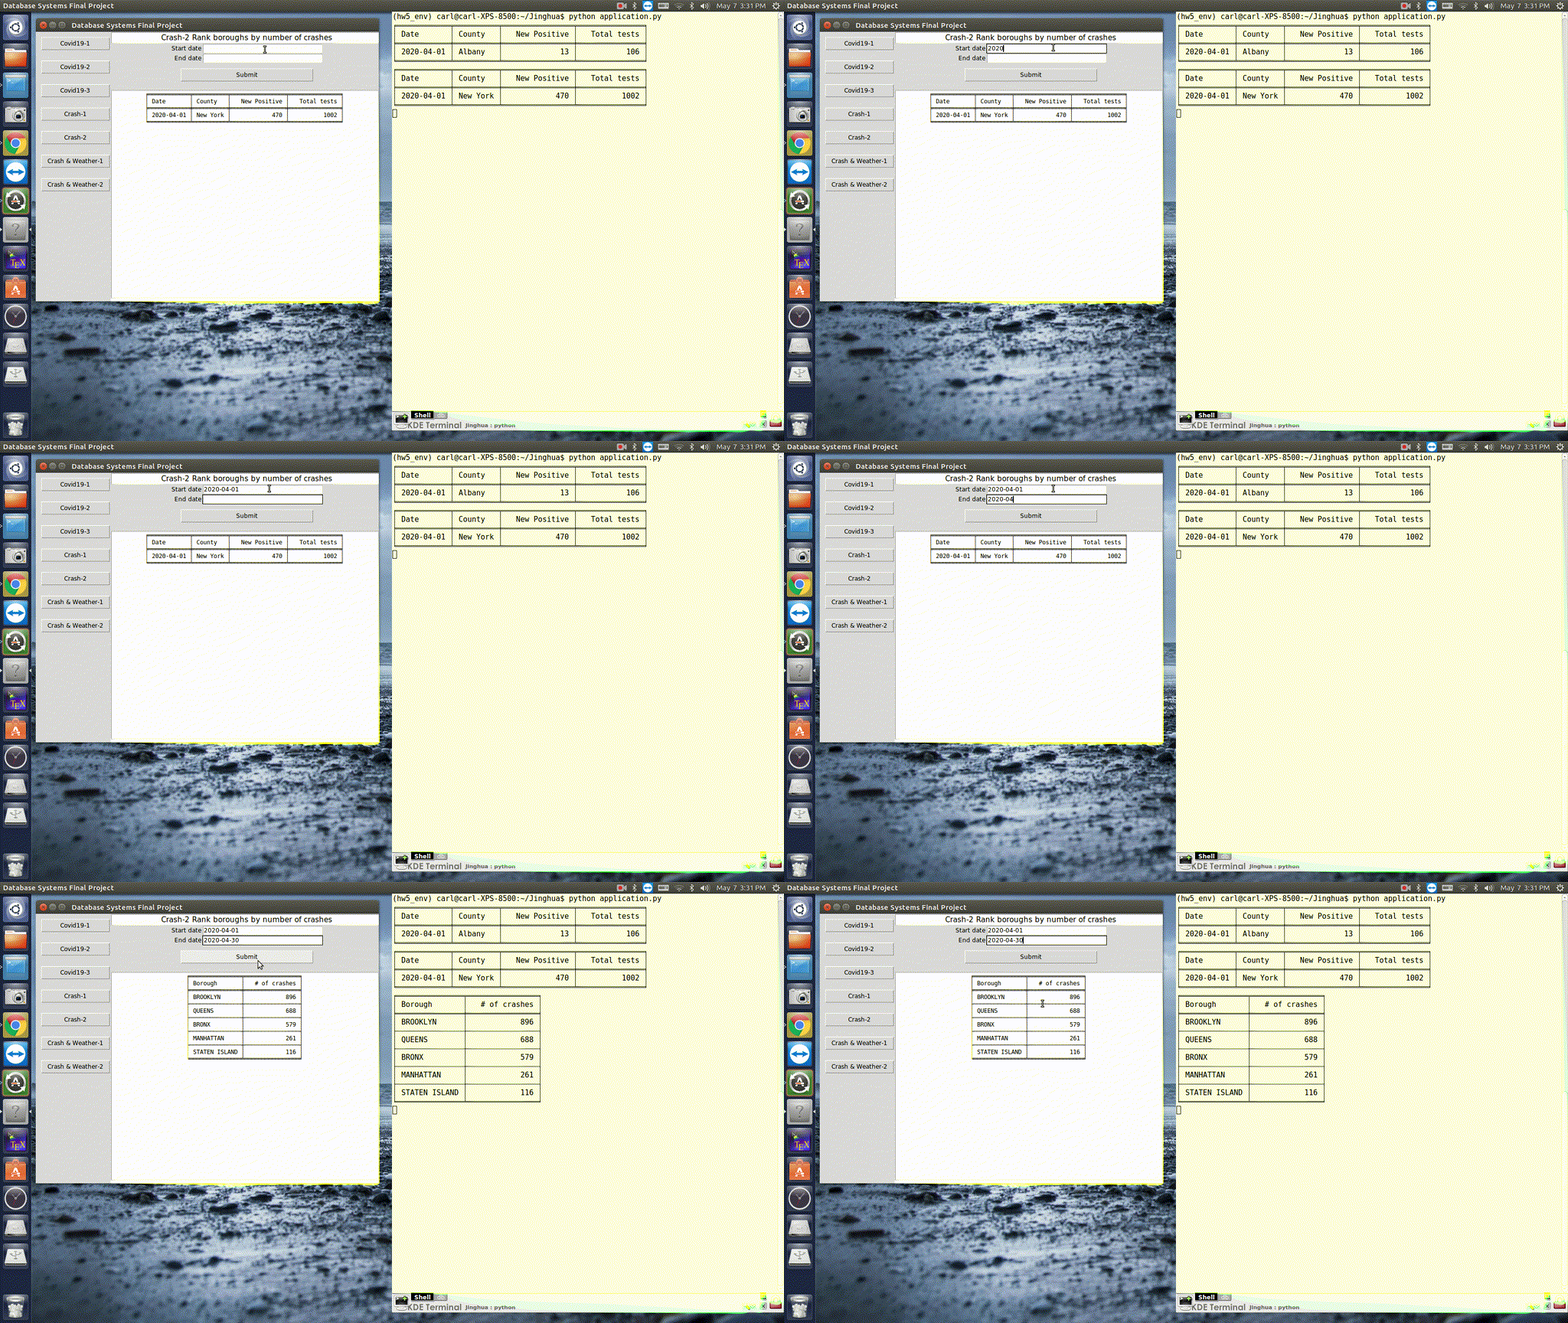
This project created a Postgres database based on three public datasets: Motor vehicle collisions of New York City, Climate daily summaries of New York City, and COVID-19 Testing in New York State. The GUI module Tkinter is applied to facilitate users' exploration and interaction with the database.

db-setup.sql: Create database with specified user and user passwordrequirements.txt: Declare the dependencies of this projectdatasets.txt: Contains three URLs for the the three datasetsretrieve_data.py: Download the three datasets in a newly created folderdatasets/load_data.py: Load the data of the three datasets into the databaseschema.sql: Create three temporary tables for the three datasetstable.sql: Create the tables for the database and then drop the temporary tables created byschema.sqlapplication.py: Create a user interface for users' interaction with database, the extracted information is displayed both on terminal and UIvideo.txt: The link for video presentation
- Setup the database
psql -U postgres postgres < db-setup.sql - Install the dependencies of this project
pip install -r requirements.txt
- Download the datasets
python retrieve_data.py
- Load the datasets into database
python load_data.py
- Running the application
- Run application
python application.py
- Go to the UI popped up on the screen
- Input the the information in the entries if neccessary
- Click submit button and the exacted information is displayed both on UI and command line
- Please see the details in the User Interface section below
- Run application
- Input: (date, county to be checked) e.g. (2020-3-4, Albany)
- Output: the new positive cases and total tests conducted in Albany on Mar 03 2020
- Input: (start date, end date, top n counties to be checked), e.g. (2020-3-4, 2020-4-3, 5)
- Output: top 5 counties with the largest number of new positive cases from Mar 4 to Apr 3 2020
- Input:(start date, end date, county), e.g. (2020-3-4, 2020-4-3, Albany)
- Output: the ratio of (new positives/total number of tests performed)
- Input: 'top number of factors to be checked, e.g. (5)
- Output: top n most common factors that contribute to crashs in NYC.
- Input: (start_date, end_date), e.g. (2020-3-4, 2020-4-3)
- Output: boroughs and corresponding number of total crashes occured in descending order
- Input: (weather type), input one of the types below
- snow, rain, thunder, fog, smoke, mist, glaze, drizzle, wind
- For instance, if snow is choosen, it will calculate the average number of crashed by dividing the number of crashes occurring on 'snowy' with the number of days it 'snows'
- Output: the number of crashes per day in this weather type
- Input: (lower limit of precipitation, upper limit of precipitation)
- Output: the average number of crashes occurring with the precipitation in selected range.
How to Program a GUI Application (with Python Tkinter)
Building Out The GUI for our Database App - Python Tkinter GUI Tutorial #20