NPYViewer 1.26
A simple GUI tool that provides multiple ways to load and view the contents of .npy files containing 2D and 1D NumPy arrays.
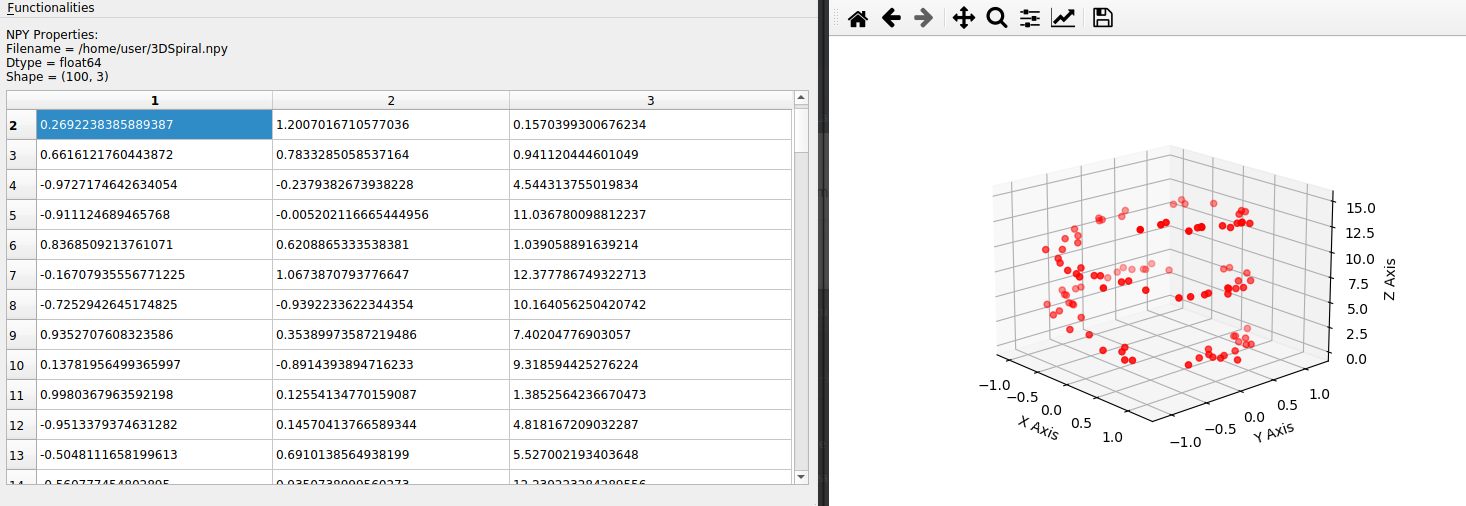
Plot 3-column 2D numpy arrays containing 3D coordinates as 3D point clouds
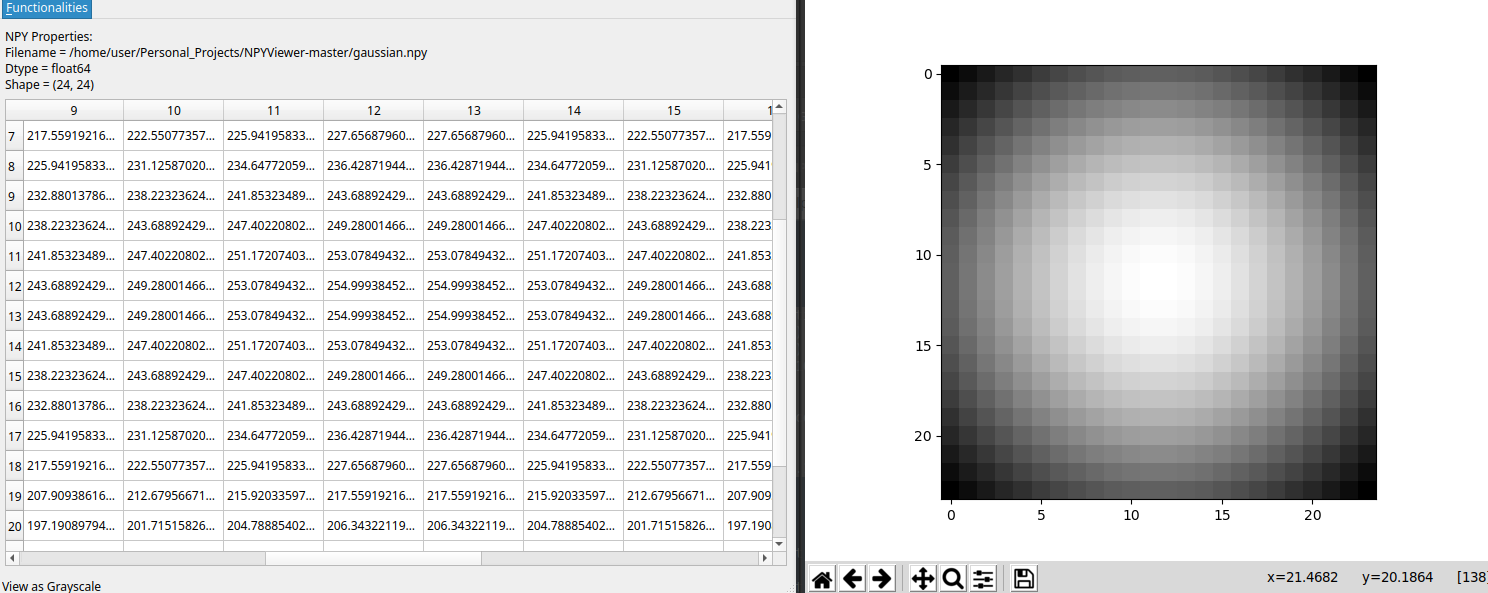
Plot 2D numpy arrays as grayscale images
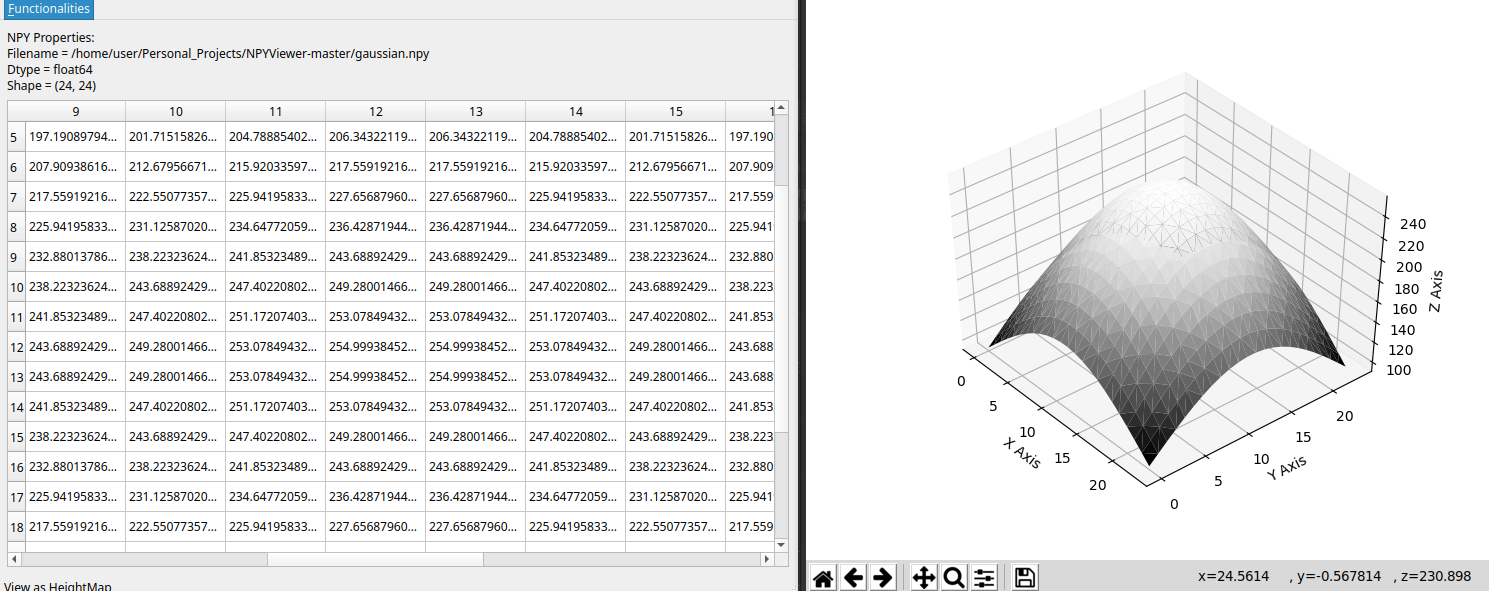
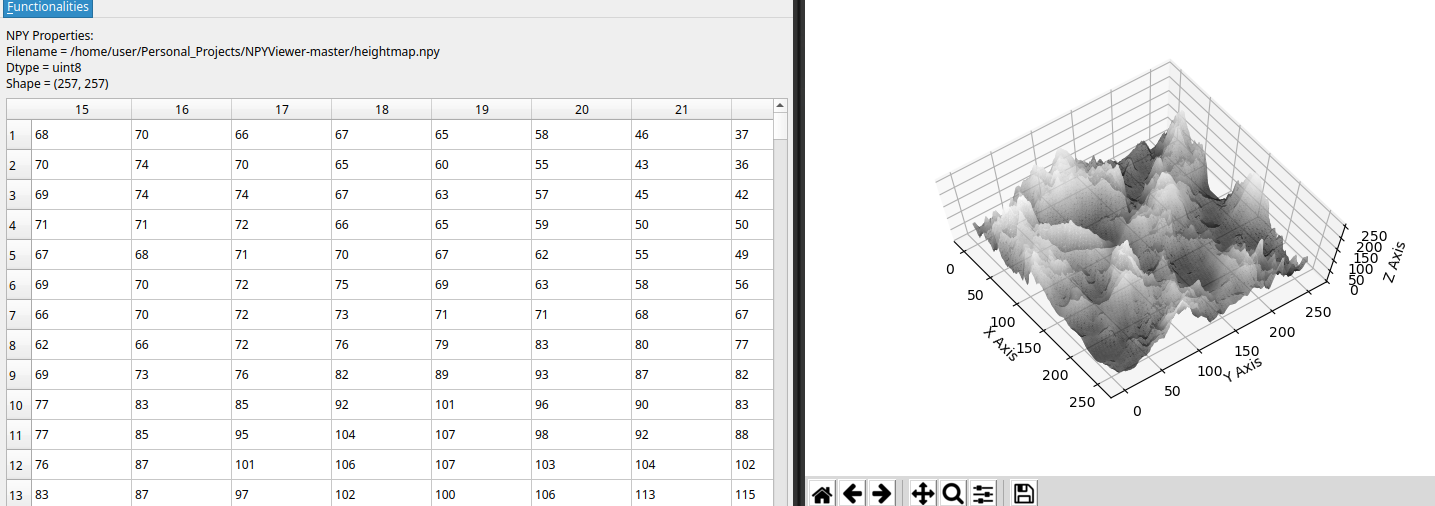
Visualize heightmaps stored as 2D numpy arrays
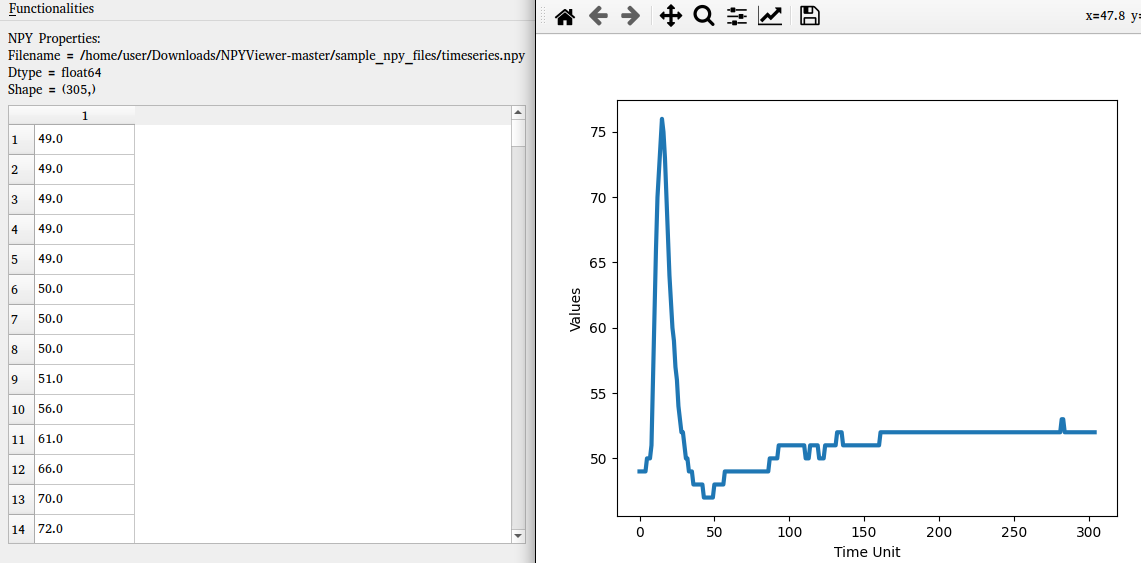
Visualize timeseries data stored as 1D numpy arrays
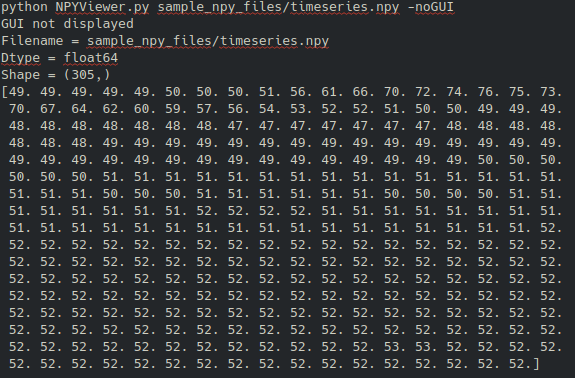
Print numpy arrays in terminal
Installation:
- Original development in Ubuntu 20.04 and Python 3.8.8
- Also tested on Windows 10 and Ubuntu 22.04
- pip3 install -r requirements.txt
Execution:
- python3 NPYViewer.py
Current Features:
- Open and view .npy files that contain 2D NumPy arrays and lists, as spreadsheets
- Convert .npy files to .csv format
- Convert .csv files to .npy format
- Export .npy files as .mat files (compatible with MATLAB and Octave)
- Plot 2D numpy arrays as grayscale images
- Plot 2D numpy arrays containing 3D coordinates as 3D point clouds
- Visualize heightmaps stored as 2D numpy arrays
- Visualize timeseries data stored as 1D numpy arrays
- Supports loading .npy files as command line arguments (e.g., python3 NPYViewer.py sample_npy_files/timeseries.npy)
- Print numpy arrays in terminal through the use of the -noGUI argument (e.g., python NPYViewer.py sample_npy_files/timeseries.npy -noGUI)
- GUI developed using PyQT5
TODO:
- Add/Remove Rows & Columns
- Copy/Paste Rows & Columns
- Data search and filtering
- Modify content datatypes
- Handle data with more than 2 dimensions
- Visualize adjacency matrices as graphs
Changes since last version:
- Added support for printing .npy files in terminal without the use of the GUI (e.g., python NPYViewer.py sample_npy_files/timeseries.npy -noGUI)
